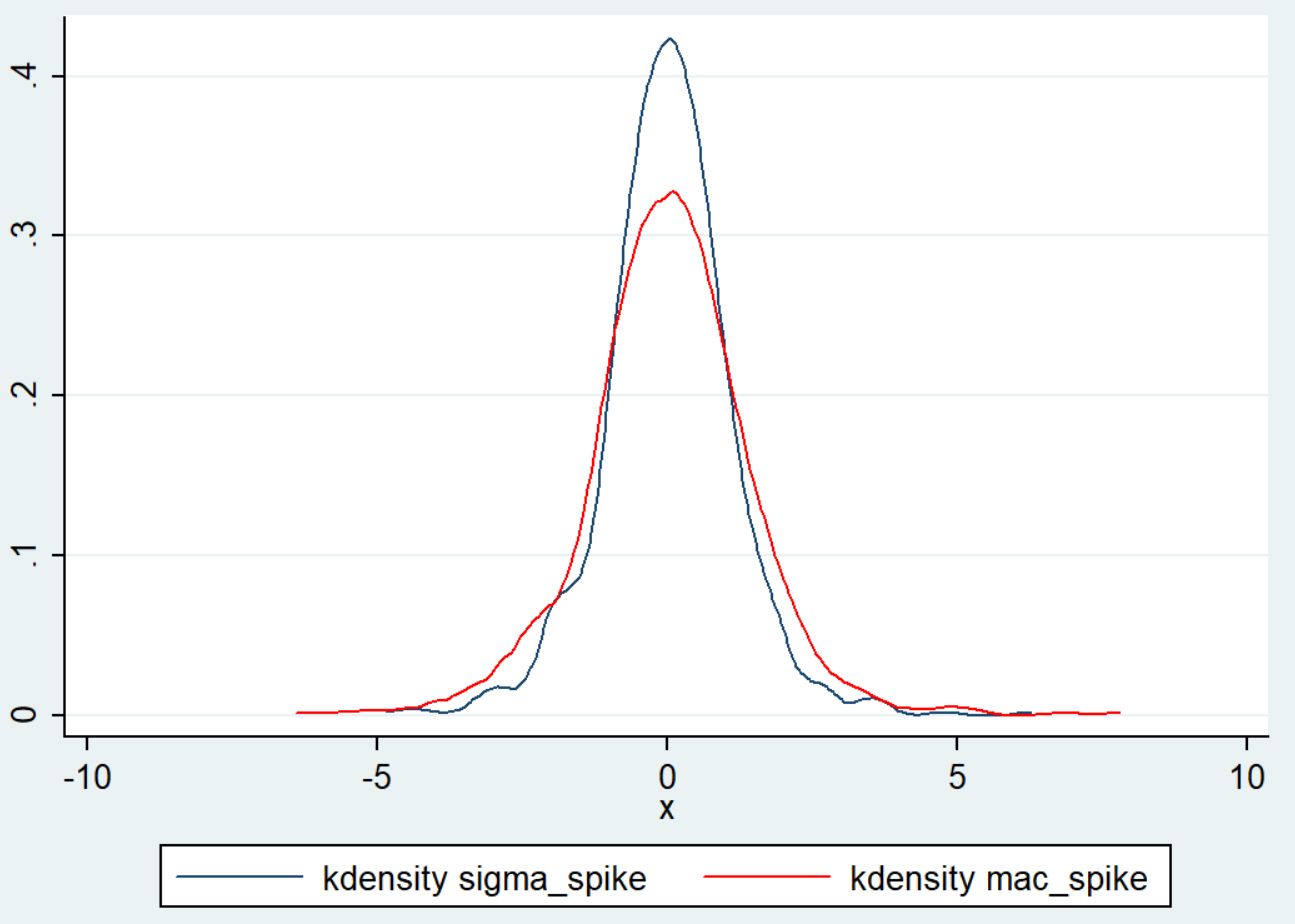
Introducing a New Tool: The MAC Spike
Good tools can help us sort through the mass of market data each day to focus on what matters. Of course, there are many things we might want to filter…
Good tools can help us sort through the mass of market data each day to focus on what matters. Of course, there are many things we might want to filter…
Yesterday, I saw someone on Facebook recommending a buy based on a moving average cross. (We already know that moving average signals are not reliable trading signals.) This person was…
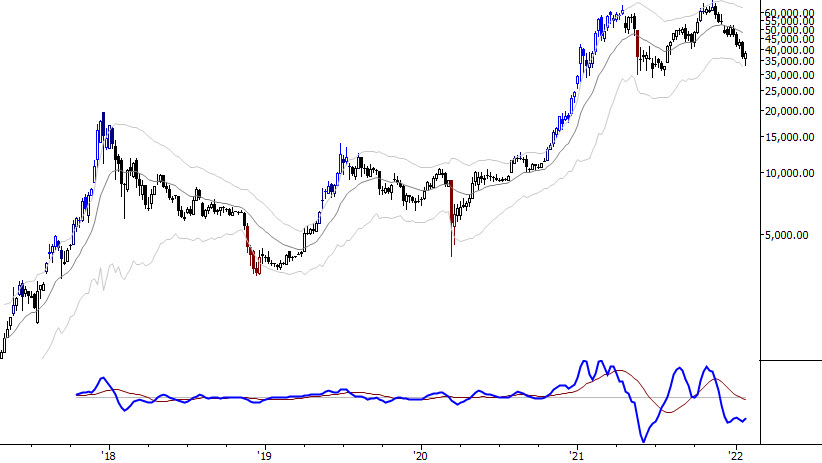
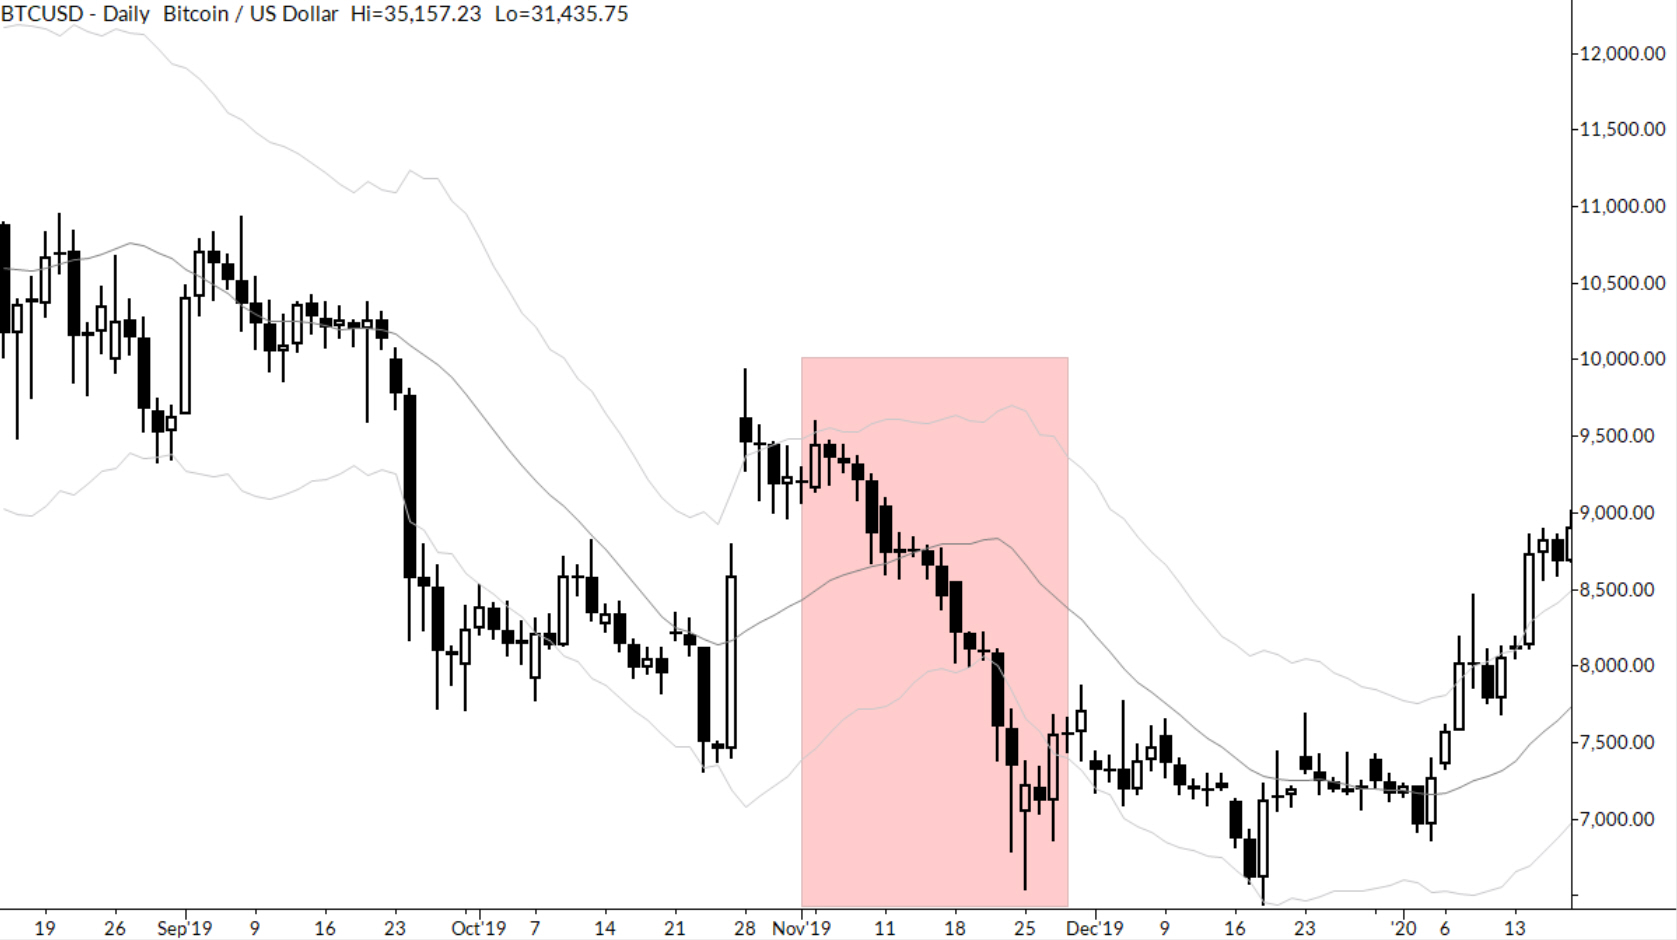
Cryptocurrencies are in focus recently. Bitcoin has fallen almost 50% from its peak, and the future seems far less certain than it did a year ago. We were able to…
“The benchmark Dow Jones Industrial Average is off nearly 300 points as of midday today…” You can hear a similar quote on nearly every news outlet many times a day,…
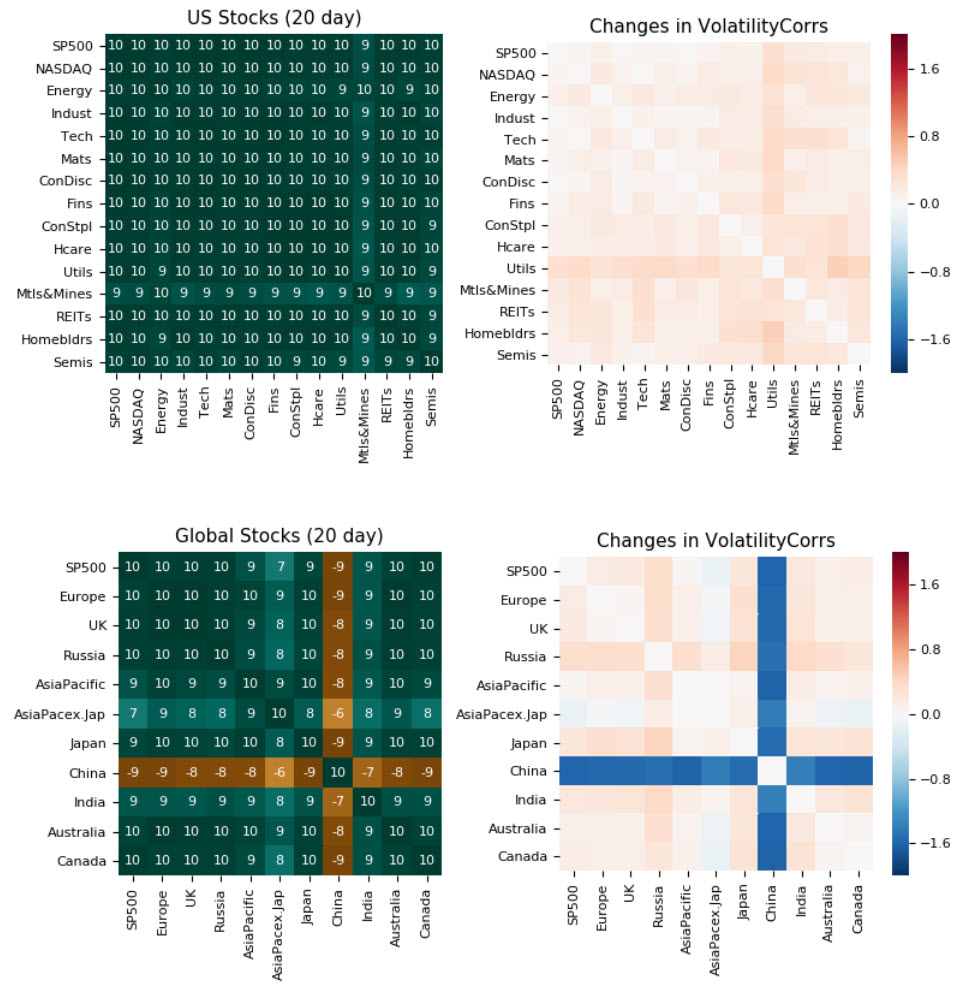
I'm always looking at new ways to look at market data, and specifically new ways to present the data visually. Much of this finds its way into my work at…
So, you’ve seen the headlines and, if you somehow missed it when it happened, you know that last week was a period of historically high volatility in the stock indexes.…
This will be a very quick blog, as I'm just typing a few thoughts here in the first few minutes of what might be a volatile trading day. This morning,…
This is the last in a series of blogs looking at December seasonality in stocks. To quickly recap, the first post used a simple binary (up/down) classification to look at…
This is a continuation of a series of posts looking at December seasonality in the stock market. The previous post is here, and the goal of this series is to…
This is a followup to my previous post that included a visualization of seasonal tendencies for about 90 years of the US stock market. A visualization like that is a good…
This is the first in a short series of blogs in which we will look at the so-called Santa Claus rally in stocks and find some answers to the question…
As we round the corner into the Thanksgiving holiday, I thought I would share another piece of my old writing. I recently found this paper as I was searching through…
This is a slightly edited version of the note I sent to my Talon Advisors clients this weekend. There is always a lot of discussion about seasonality at the end…
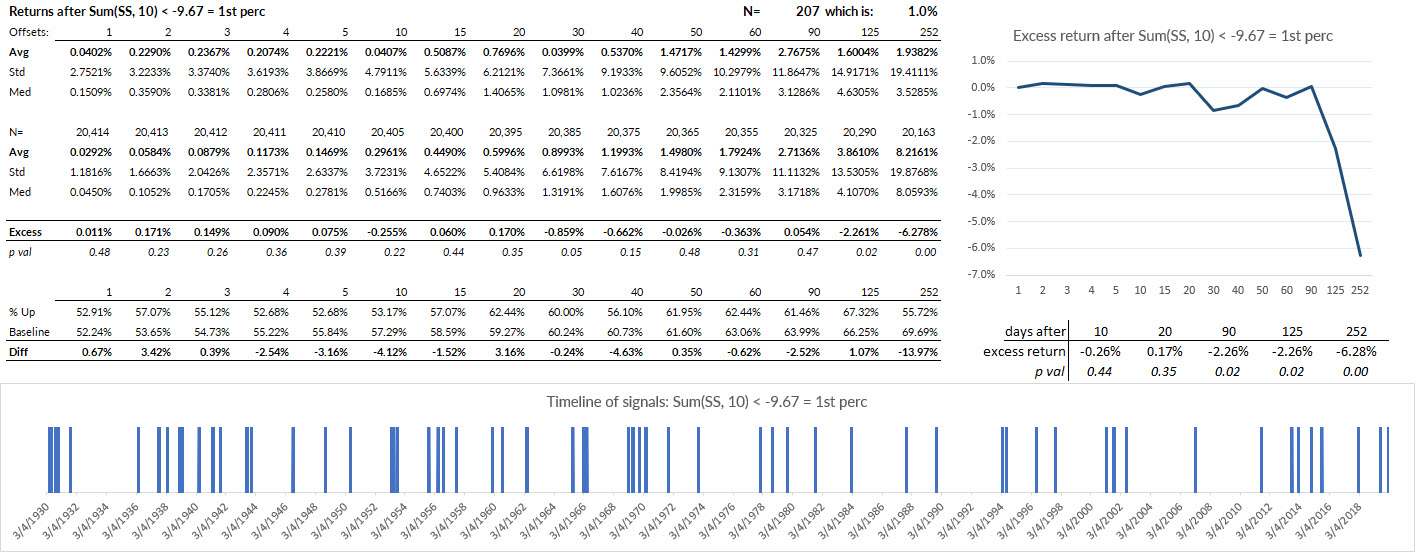
Let's think a bit about "signal generation". When we test something in the market what we're looking for is an answer to "What happens after _______ occurs?" This is really…
There’s been a lot of discussion and stats thrown around recently, much of it centered around the idea of “like we just had the worst October ever.” I thought it…
Please read my last post first, before you begin this one. I ended the last post by suggesting that we were probably more interested in changes than in price levels.…