One of the indicators I use on virtually all of my price charts are Keltner channels +/- 2.25 ATRs around a 20 period exponential moving average. (As a point of trivia, we call these “Keltner Channels”, but they are much closer to the STARC (Stoller Average Range Channels).) It is possible to structure similar trades around other “volatility-aware” bands such as Bollingers, or Keltners calibrated to different ATRs and different average lengths. As always, it is important to understand the tradeoff with different tools and parameters.
Raw Keltner Statistics
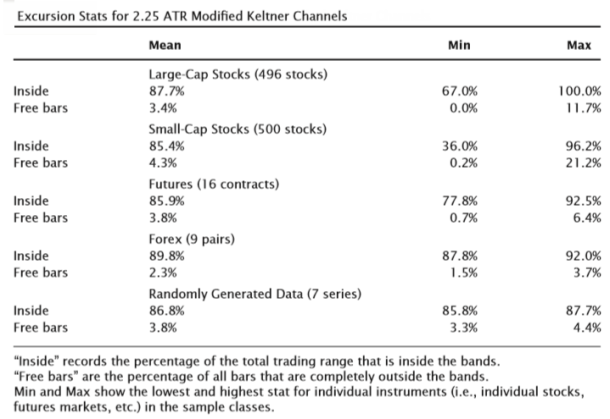
One of the first things we need to understand about channels is how much of the market action is contained within the channels. The following table (drawn from my book) gives statistics for a large universe of stocks, futures, forex, and randomly generated price series. The Mean column shows that Keltner channels constructed with the parameters I use contain a little more than 85% of traded prices; the corollary to this is that price action beyond the channels is unusual, though not automatically indicative of a price extreme.
Another important statistic to consider is that “free bars”, bars which are completely outside the bands (low > upper band or high < lower band) are quite unusual and may demand special attention. Last, the Min and Max columns show these stats for individual stocks/futures contracts/currencies. There was, for instance a stock that had 100% of its price history inside the band, and one that spent 33% of its time outside the channels. More than anything, this is a reminder that there can be considerable variation in statistics when applied to real market data. (Note the “randomly generated” price series appear to be much better behaved, and this points to subtle evidence of non random price movement in the actual market data.)
Keltner Fade Statistics
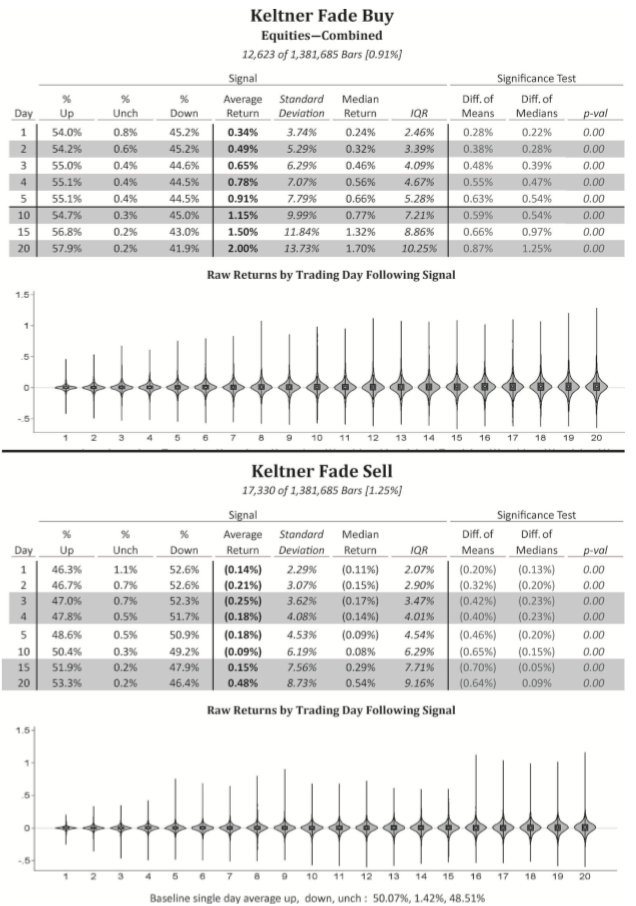
The following tables show the results of buying any close below the lower channel and shorting and close above the upper channel, assuming that no other trade in the same direction has been entered in the previous 10 trading days. The important columns here are the Diff of Means, which shows the “excess return” (trading signal return – baseline return for the test universe) and the p-val, which is a significance test. There is a clear and persistent edge in fading moves beyond the Keltner channels, but we would not use this as a stand alone system. Rather, use the tendency to identify potential inflections in the market and combine with other tools for actual entry techniques. This is a simple test of mean reversion.
Keltner Pullback Stats
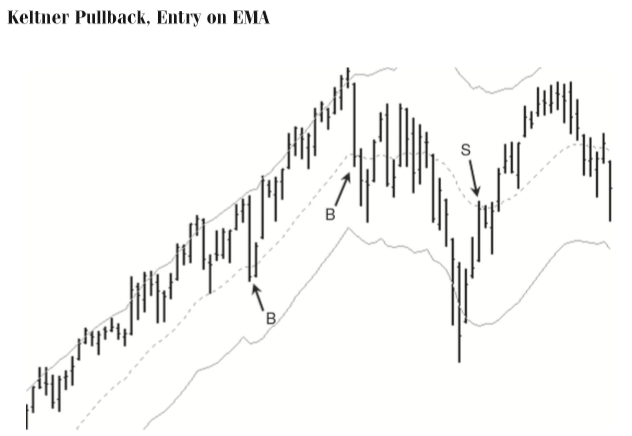
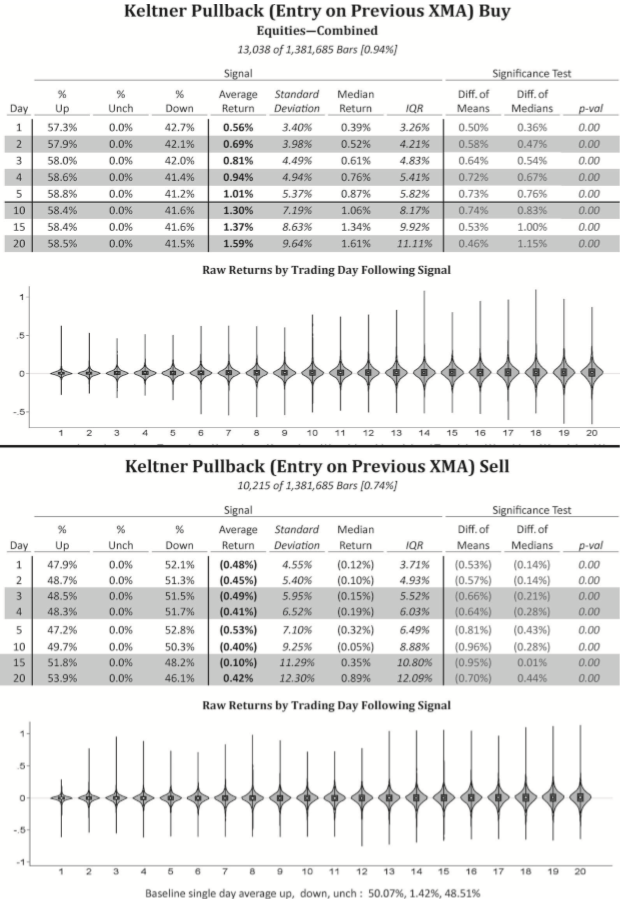
Pullbacks are trend trades, using the natural pauses (or pullbacks) in trend to enter in the direction of the trend. For instance, in an uptrend, we might look for an area where prices pause or move downward, and look for a spot to buy the market, expecting that the market will make another upward move. There are at least two obvious issues: how do we define a trending market, and where, exactly, do we enter? It is possible to structure pullback trades using Keltner channels. In this case, we first look for a move beyond the upper (lower) band for a long (short) trade, and then look to enter when prices touch the previous day’s moving average. (It is also possible to use the current day’s value, but that is a less realistic test since the value of that average is not known until the bar closes. The previous day’s average, however, is known from the first tick of the current bar.) First, a graphic illustrating this trade, and then a set of stats for executing the trade on a large universe of stocks.
Conclusions
These have been very simple tests of price tendencies around Keltner channels. We find an edge for mean reversion outside the bands, and a possible trade setting up continuation (momentum) with a structured pulback within the channels. Other tests and tendencies are possible, but these are a few of the more common and most fundamental price tendencies around channels.