Let’s cut straight to the punchline: the answer is, “it turns out, quite a lot.” Continuing on this week’s series that attempts to break down important technical trading ideas into easily digestible pieces for everyone, let’s take a look at probability and luck, and the part they play in our investing results.
People selling investment tools or advice are, in some sense, selling an illusion of certainty. We can use whatever words we like–consistency, security, risk management–but what it comes down to is that humans have a very natural desire for safety and security. We want to know what the right actions are, and that those actions will lead to the desired results. We think we are prepared, and that we can handle some variability. For instance, in cooking a steak, we might know that sometimes the piece of meat will be tougher, more flavorful, or have a little better fat marbling–so we know that the steak we cook tonight will not be identical to the one we cooked last week. But what if we cut the meat, get the grill to just the right temperature, season the meat perfectly, start to sear it, and then our house gets hit by a small asteroid that wipes out our entire town? That’s a degree of variability we, generally, are not expecting. Though the example becomes a little silly (and the steak is overcooked), surprises like this happen in financial markets far more often than we’d like to admit.
Randomness is a problem for traders and investors. It’s a problem objectively because it makes our results highly variable (even if we’re doing exactly the right thing), and it’s a problem subjectively because we (humans, all of us) have very poor intuition about randomness. Looking at any market, most of the time, most of what you see is random fluctuation–meaningless noise. We don’t deal well with meaningless noise; our brains are fantastic pattern recognition machines; they find patterns with ease, even when no patterns exist. Many pages have been written about cognitive biases in investing, but one of the most serious is that we don’t understand randomness intuitively very well. Consider these questions:
- How many people do you need to get together in a room to have a 50% chance that two of them share a birthday?
- If you flip a perfectly fair coin a million times, is there a good chance or a bad chance you will have 500,000 heads at the end of that run?
- If I flip that coin only 30 times, what is the chance I have 5 heads in a row, given that it’s a fair coin? You don’t have to give me a number, just tell me is there a “pretty good chance” or “almost no chance”.
- How likely is it for someone to win a lottery twice?
You probably get the point that, unless you’ve studied probability and statistics, your first answers to those questions are probably dramatically wrong.
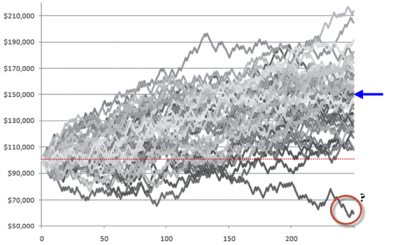
So now let’s think about the market. Market data is highly (but not completely) random, and our interactions with the market will unavoidably pick up some of that randomness. For example, take a look at the chart below, which shows theoretical results for 50 traders each taking 250 trades of the same trading system. (Each separate line represents an individual, theoretical trader.) The system had a positive expectancy, and none of these traders made any mistakes, so they all “should have” made money. Look what happened:
 This is a crowded graph that is pretty hard to read, but the lesson is simple. The blue arrow shows what the expected value of the system actually was, but look how far spread out the ending values are. Also, notice that many of the lines were under the dotted red line (the starting value) for a long time, showing that many of these traders had losses that lasted for over 100 trades! Furthermore, one trader actually ended the run losing a significant amount of money. (If you want to read more about this example, it’s drawn from my book (pp 270 ff), or you can read more in this post.)
Few traders are prepared for this degree of randomness in their results, and, yes, let’s use that dirty word: some traders get lucky and some get very unlucky. Even though each of the traders in that example above were trading a positive expectancy system, many of them probably would’ve pulled the plug early on, and imagine the psychological stress some of the “losing traders” felt! One poor trader was never above his starting point, while he had to watch a friend double his money using the same system. This example is powerful because we’ve removed everything except luck from the equation. There were no mistakes, no emotions, no analytical prowess, no tweaking of the system; the traders simply, perfectly, blindly took each trade as it came along, each trade result was independent of the result that came before it (i.e., was random), and the divergence in their results is due to one factor only: luck.
So, that’s great, right? Some people get lucky in the market and some don’t. If that’s all I have to say, maybe we should just go to Vegas and put it all on black for the first roll, but hold on, there’s a better way. In my next post I’ll take this a step further and share some observations about how you can manage luck and uncertainty in the markets. There are some good lessons here, no matter how you trade or invest.

Some Fun : If on an actuarial basis there is a 50% chance that something will go wrong, it will actually go wrong nine times out of ten. …. So its better You Start getting ‘Lucky’ & Right Now …. 🙂
Pingback: Thursday links: a potentially false doctrine | Abnormal Returns
So true and depressing…. When it comes to trading unless you have a few years a front of you, It often comes down to how you start. Get unlucky at the beginning and your allocation get cut and it takes more time than anticipated to recover if you ever manage to do it. Nice post.
Pingback: The Whole Street’s Daily Wrap for 11/20/2014 | The Whole Street
Unfortunately the banking industry can’t market ‘luck’ to retail clients, so they market ‘expertise’ and ‘certainty’. The ‘blind leading the blind’…
Great blog, just found it!
I don’t understand how you’ve arrived at such variance for the above study. Were the traders trading different securities or placing trades at different times (eg market open vs market close) once a signal was generated by the system?
For example, would expect if a system generated a signal to buy at $10.00 and then sell at $11.00 (or stopped out at $9), then trader’s would do this at these price levels and Equity Curves would all be very similar. If they couldn’t do this then they’re not following the system or perhaps the system modeled above has a big discretionary element causing this variance (eg traders pick and chose which buy/sell signals to take)?
PS – as an extension to the different times option above, I’d definitely expect trading this system in 2008-2009 (high volatility) vs trading it 2013 (low volatility, trending market) to generate hugely different returns. Have assumed this is not the case with these and the results are all taken from the same time period.
I think you are slightly overthinking. Did you read this post (linked from the post above) that explained the process in a bit more detail?
https://adamhgrimes.com/the-slings-and-arrow-of-outrageous-fortune/
And, yes, you’re running into exactly the point… which is that variability, in most cases, is much higher than we might intuitive expect.
Hadn’t read it, thanks for the clarification. That chart is pretty crazy, looks like quite a few trader’s hit the 10-15% drawdown phase early on, which in the real world could lead many to completely abandon the system altogether (both on an individual and institutional level).
Pingback: Artikel über Wirtschaft, Finanzen und Devisen - 23. November 2014 | Pipsologie
Pingback: Luck: The Difference Between Hired or Fired – Flirting with Models™
Pingback: ¿Necesito suerte para hacer trading? | Trader Elite
Pingback: Trading a long complicated pullback in the Dollar - Adam H Grimes