Testing Fibonaccis (1/2)
Warning: this blog post is not appropriate for all readers. You may find it challenging or disturbing, especially if you are not open to questioning some long-held beliefs. Reader discretion is advised.
Now that we have the (obviously joking) disclaimer out of the way, I want to continue looking at Fibonacci ratios in market data. (If you haven't already, read this post and this post for background, and, all joking aside, this will be pretty data heavy for a blog post.) What I am going to share today comes from the unpublished portion of my book; one of the bigger parts of that unpublished portion was quantitative work supporting the patterns and tendencies I trade. This work was done on a universe of 600 active stocks; 16 liquid, domestic futures markets; 6 currencies; and several variations of randomly generated price data (pure random walk, GARCH models, "scrambled" price bars, etc. The market data covers 10 years beginning in 2001.)
The first thing I did, working with daily data, was to define swings using my AlgoSwings® tool. This is one of many ways to define swings in the market, and, though I don't show the results here, I also looked at many other specifications for swings. In addition, the AlgoSwings® model is based on market structure, looking first for a pivot defined, for a high, by N bars of lows before and after the pivot. The swing change is further qualified with a volatility filter, using 2 ATRs as a default. Both of these inputs can be changed, with the effect of filtering out more or less noise and producing more or fewer smaller swings. You will see slightly different results based on these inputs, but the results I show here today hold true across a very wide range of parameters, or even using other tools to define the swings.

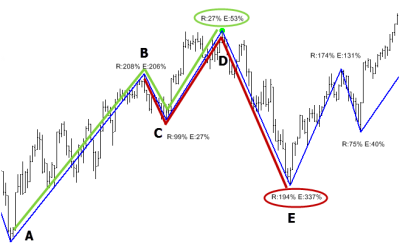
Next, we measure each swing as a percentage of the setup leg. This can be a bit confusing, so refer to the (admittedly pretty ugly) chart above for an example. At point D, the market has made a complete three swing move: the setup leg (A-B), a retracement (B-C), and then an extension (C-D). At point D, we define both the retracement and extension as a percentage of the setup leg. The "R: 27%" means that B-C was 27% of A-B; the E: 53% means that D-C was 53% of AB, not 53% of B-C. This is a possible point of confusion, so be clear on this: both legs B-C and C-D are measured relative to A-B, since A-B is the setup leg for the structure. At point E, we are able to define the next three legged structure, this time based off of B-C as the setup leg, and the percentages at point E show C-D and D-E as percentages of that B-C leg. Those structures are highlighted in green and red to make them stand out more clearly. Spend a few moments thinking about this, so that you are sure of what we're measuring.
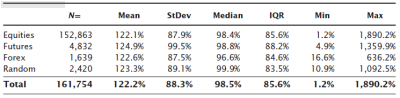
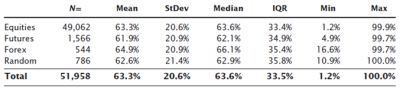
This table shows the raw retracement stats for all swings in the test universe. We immediately see a problem: you could argue that retracements greater than 100% of the setup leg are not actually retracements at all, and you would be correct. (Look at the previous chart. Is C-D actually a retracement of B-C, or would a better interpretation be that C-D is continuing the uptrend and that B-C is not a setup leg for a downswing at all?) Though I did the work with and without a trend filter, applying a simple filter that removes all swings greater than 100% of the setup leg is a good idea. The next table shows the swings with the simple trend filter applied.
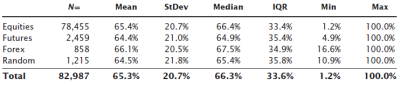
Two points jump out from this table: First, the real market data "look a lot like" the random sample. Though this is not any type of valid quantitative test, it is a good first step when looking at market data. If we compare against a random baseline, we want to see that the market data somehow looks significantly different from random data. Otherwise, there is a good chance that what we are looking at might simply be random, and this is bad because you cannot make money trading something that is random. (I just glossed over a very important point, but a major emphasis of the course I am preparing will be that randomness is, statistically speaking, the enemy of successful trading. Trading and analytical techniques have to be able to overcome randomness or they stand no chance of success. Much more on that concept later. (And yes, I realize that the True Believers may already be saying that of course these ratios are so important that even random number generators would be obeying them. That's also a discussion for another time.)) Second, we can't see any clear evidence of Fibonacci ratios in this table. The average retracement, around 65%, is not the Golden Mean, and the very high standard deviation means that we're not even very "sure", statistically speaking, that the mean is a valid measure.
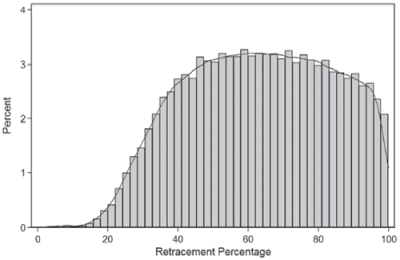
A good next step would be to look at a histogram of the retracements. Maybe we can tease out some evidence of Fibonacci ratios there, especially if we see a bimodal distribution with peaks around some of those important ratios that traders use.
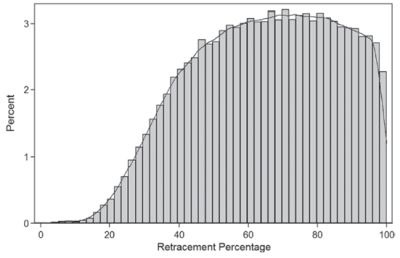
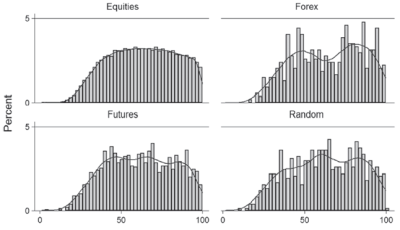
There seems to be no sign at all of the Golden Mean being important here. What about if we break it down by asset classes?

Hmmm… this does not look good for the Fibonacci ratios. Let's go one step further. In any analysis, we want to be careful to avoid using data from the future, that would not have been known at the time of the test. In this case, let's lower that barrier and allow ourselves to only look at "the best" trades. Though we see no evidence of Fibonacci ratios being structurally significant in a large sample of market data, perhaps they work better in the best examples of trades. Again, there are many ways you could define this, but I added a simple set of conditions: 1) the extension is at least 25% of the setup leg, to assure adequate profit potential; 2) For a long setup, the low of the retracement must be higher than the low of the setup leg (already captured in the 100% retracement/trend filter in the earlier test); and 3) the extension must make a new high relative to the high of the setup leg (D > B). Here are the results with those additional filters:
I think this is a good place to stop for today. Spend some time looking at these charts, and think about what they represent. For perhaps the first time, you now have an objective view of what retracement ratios really look like in the market, across a large dataset and several market regimes. I'll come back tomorrow, and we'll consider what these results might mean, and will also think about the limitations of any analysis and what we might have missed.


