Fibonacci: Thinking Deeper
Thinking about how to build a test for Fibonacci ratios in market data.
[dc]F[/dc]ibonacci ratios are one of the most commonly used (or, at least, best marketed) tools in the trading literature. For years, I struggled to see their utility. I saw what other traders were doing, but often saw so many lines on charts that it appeared that any market move could be justified as coming near some line, or some confluence, or some projection, or some time extension, on some timeframe or some extrapolation thereof. It always seemed like an idea that could be better for explanation than for placing traders in real time and I wasn't sure how many people were using it profitably. In addition, it's a difficult concept to discuss because many Fibonacci people tend to be True Believers. Some of them tie the ratios to their philosophical or religious beliefs, and it's not at all rare to hear people say things like "you can't even really test Fib ratios because it is just art. You just have to accept that it works."
I also became suspicious when I saw the claims about how Fibonacci ratios and spirals were so critical in nature and art. As a musician and a composer, I had done extensive studies of musical compositions and extended that to other artwork. I'd even spent some time working with people who were refining algorithmic processes in which computers basically wrote music themselves, trying to emulate the factors that humans found pleasing in human compositions, so I'd done some serious investigation into the topic. I knew from this work that much of the public perception about the importance of ideas like the Golden Mean was somewhat overblown. I had seen examples of what were claimed to be exact proportions in popular texts or articles actually prove to be close approximations. (Like the photo of a chambered nautilus shell not quite fitting the Fibonacci spiral in this post.) I confess I counted whirls on pine cones and found that they were sometimes Fib numbers, but, often not. I had long familiarity with Fibonacci and the Golden Mean and had already done much of this work, so I was not surprised when I found people applied these ideas to markets, but why were people so adamantly opposed to any quantitative verification or testing? Why was this something we just have to accept on faith and vague appeals to sacred geometry, the Mind of God, and the hidden structural foundations of the Universe itself? If it was so important, why can't we test it?
See, there's a problem here: if something is significant, it has to show up in the data. (On a different note, but related concept, consider the adage correlation does not imply causation. This is true. You can have two highly correlated data series without any causative link, for several reasons. Everyone knows this, but what might not be so obvious is that causation does imply correlation. Perhaps not correlation in the strict sense of a linear relationship, but you cannot have a data series that has a causative link to another one and not have a relationship apparent in the data.) If Fibonacci ratios really are so critically important in the market, it should be rather easy to structure a test that shows this to be true, but, the more I looked, the more obvious it was that these tests didn't exist.
Now, I do think there is a middle ground. Some authors, for instance David Aronson in his excellent book (which has one of the clearest expositions of statistical inference I have ever seen in print, by the way), claim that knowledge is essentially meaningless unless it can be quantified and tested. I believe that there are elements of the trading and analytical process that may resist being quantified—intuition and inductive reasoning are examples, but tendencies and structural inflections in the data should ring through loud and clear. If there truly is structural significance to Fibonacci ratios, it shouldn't be too hard to devise a test. I would imagine that a test might work something like this:
- Define swings in the market through some consistent methodology. Many possibilities exist, so it's probably worth our time to do this a few different ways. We could even do it by hand, but would need to be objective about it and collect many examples.
- Measure each swing as a retracement of the swing before it.
- See what the data says.

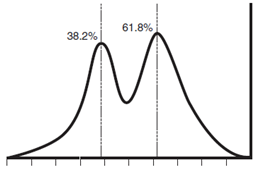
A fairly simple procedure and this seems like it should be a valid test. What would we expect to see if these vaunted ratios really are significant? Simply, more retracements should terminate near Fib ratios (perhaps 38.2% and 61.8%) than at other values. If we were to plot a histogram of retracements we might see something that looks like the chart: a bimodal distribution with peaks near the ratios. At the very least, we should see some evidence that they are significant. If these ratios allow us to "read the mind of God" and reckon the foundation of the Universe, as practitioners claim, then surely we can tease them out of the market data?
(More to come. I'll share some data from the unpublished part of my book in a future blog post.)
// < ![CDATA[ <span style="overflow:hidden;line-height:0px" data-mce-style="overflow:hidden;line-height:0px" id="mce_3_start" data-mce-type="bookmark"> // ]]>


