Cycles, Cycles Everywhere
I want to share a few of the things I have been thinking about and focusing on in the market. This market environment is not that different than "business as usual", so we have lessons here that will apply to most markets, most of the time.
Cycles
I had an interesting discussion with a Gann practitioner this week (no one was injured!) This poor soul was applying super-sophisticated time and ratio analysis to a bunch of markets, and using a correlation of raw price. Without going into a full math class of details, that's a meaningless measure--we run correlations on changes rather than price values because we care about how markets move. It was interesting to see someone so deeply into esoteric measures, completely mesmerized by the rhythms of cycles, but missing math knowledge that any first year stats student would have.
But that conversation bumped into some work I've been doing for myself and my own trading.
There are cycles in the market. The problem is that, I think, most of them are not cycles in time. Rather, they are cycles driven by human emotion. One way to think about it is that it's a kind of non-linear time that is marked by events and reactions to events--more kairos than chronos. It's time measured by human experience rather than the ticking of a clock.
This points us to where a discretionary trader might have a significant edge over algorithms. A trader can fall in step with these cycles, and anticipate their turning.
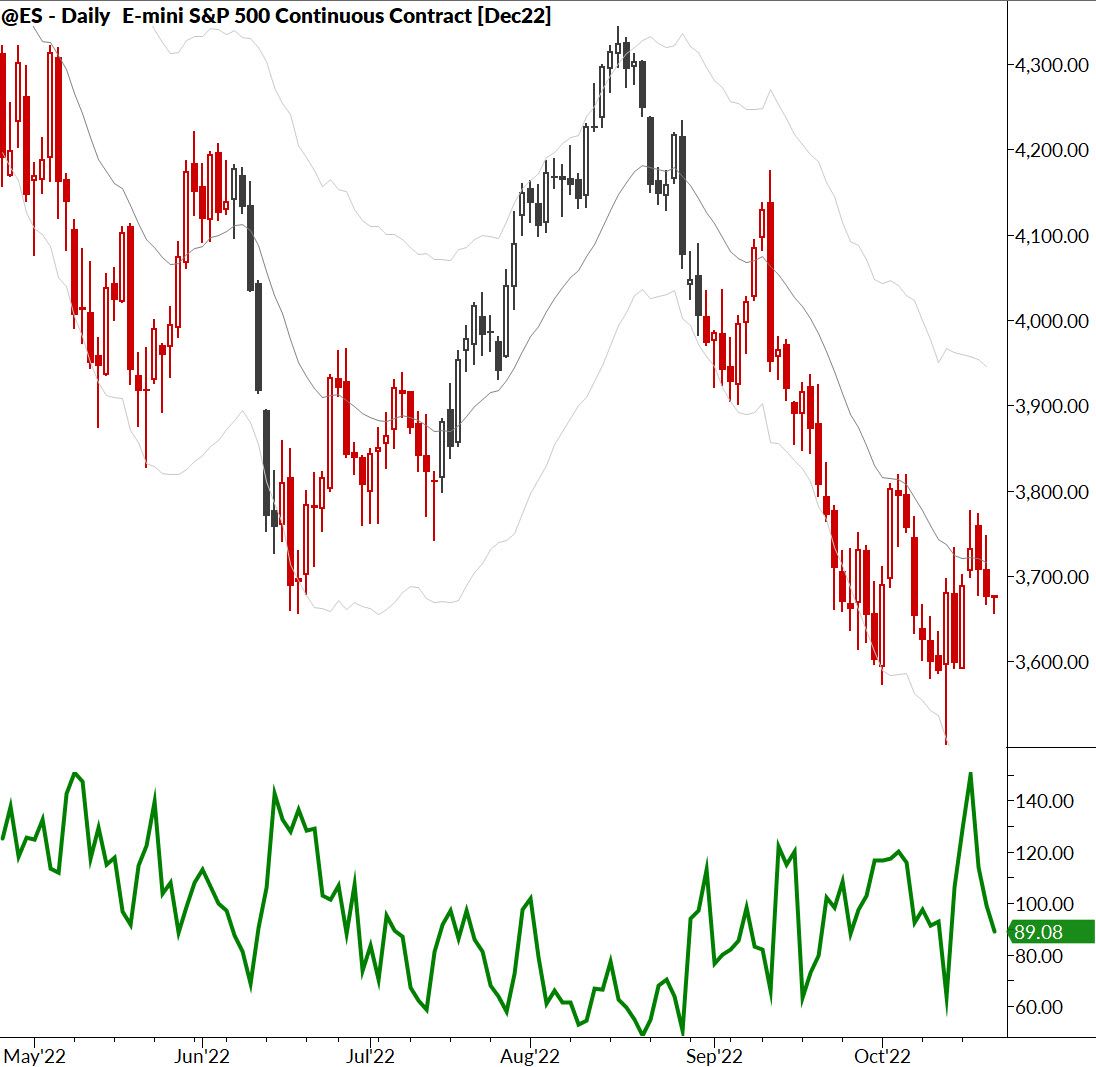
There's so much more to say here, but I'll just share this. Take a look at the chart at the top of this post which shows the S&P 500 futures with a 3 Day Average True Range (ATR) in the panel below. Now a 3 day ATR is a very noisy measure and you might say it is ridiculous to look at such a short time span for ATR. I would usually agree with you but...
The volatility cycle
Possibly the most significant cycle in the market is the alternation of rest and movement, of momentum and consolidation, of volatility contraction and volatility expansion. Many of the "new trader mistakes" come from being out of step with that rhythm--if you a chase a moving market, it often goes dead and dull or reverses.
In a very real sense, your first job as a trader is to understand what this volatility cycle is going to look like in the near future. It has everything to do with whether prices are most likely to move cleanly or to chop back and forth around a level.
Using an indicator to measure
This short term ATR can help measure that cycle. Look at areas where the line is falling--these point to volatility compression on the chart, and to a market that might be primed to make a move. If you do nothing more than look to position on breaks out of these compressed areas, you'll likely be ahead of the game.
There are plenty of other games you can play to measure this. One of the time-tested methods is to take two volatility measures of different periods (say, looking at a weekly and monthly ATR), and then looking at the ratio of those two measures. When the short-term measure is low relative to the longer-term, you're likely in volatility compression.
I would be cautious about leaning too much on any indicator. They all lag, and, at best, reinforce what we can already see on the chart. I think they have most use for developing traders to help structure their study of charts, and some may find application in some algorithmic approaches.
From theory to practice
In practice, we do much more with this, evaluating volatility and trend across several related markets, looking at "small patterns" involving a bit of pattern recognition, and understanding where we are in the market structure. There's also a bit of intuition involved, but that intuition grows after long exposure to market data.
Don't try to force this cycle into a procrustean bed bounded by the precision of bar counts--sure, you can do it: "Ok the cycle looks like it's 4 bars here, but then it misses and we need to push it forward... oh the downward cycle aborted, so we reset from here... maybe we overlay a 6 period cycle here..." These are the games the cycle fanatics play and they can create impressive charts... but I'm doubtful they can trade their way out of a cardboard box. This kind of work just doesn't work in practice.
Why? Because these cycles do not exist in chronos time... they do not respect the ticking of the clock, the rising and setting of the sun, or the terrifying precision of atomic clocks. No... they live in the hopes and dreams, fear and greed, elation and desperation, of human traders.
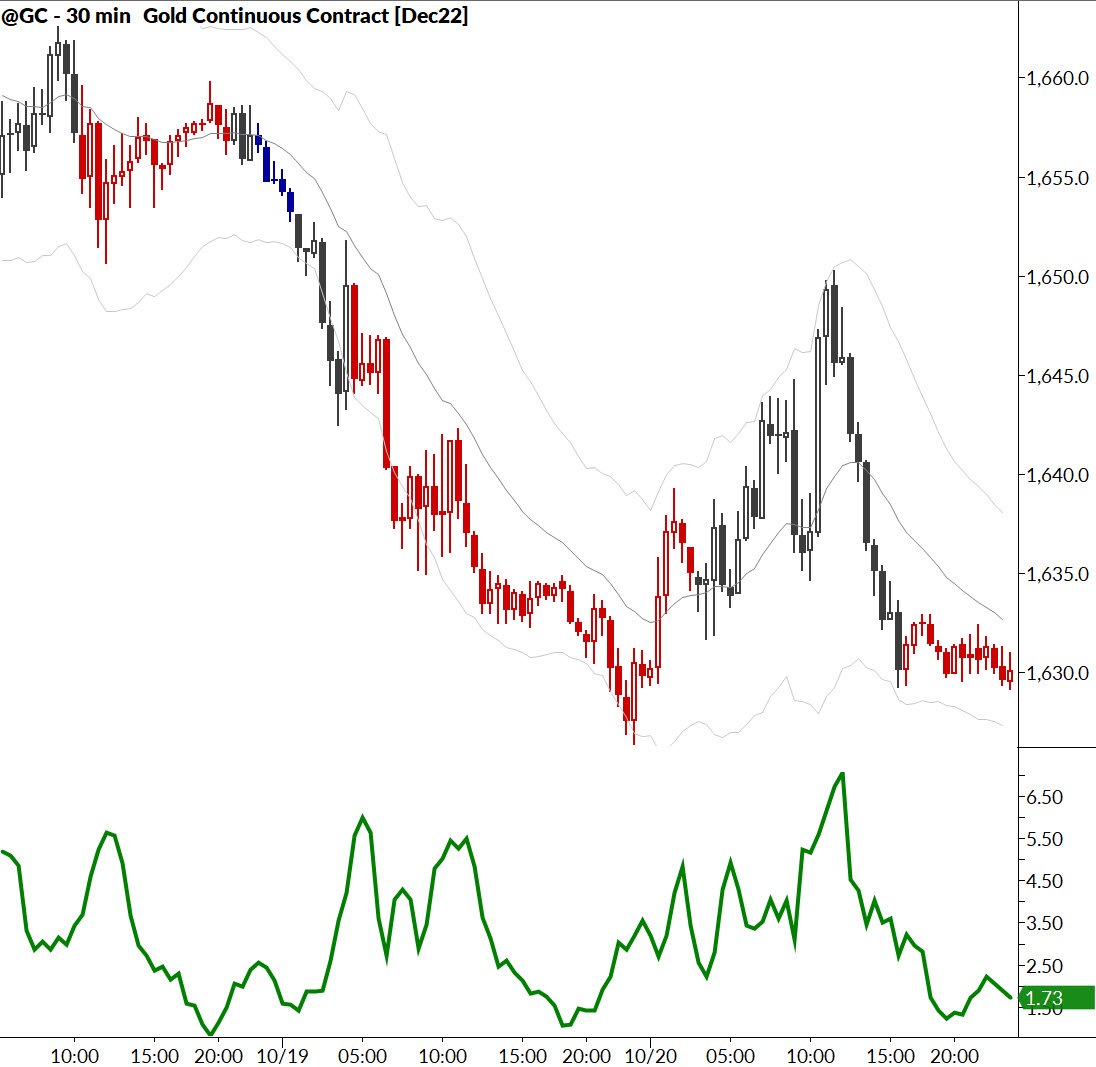
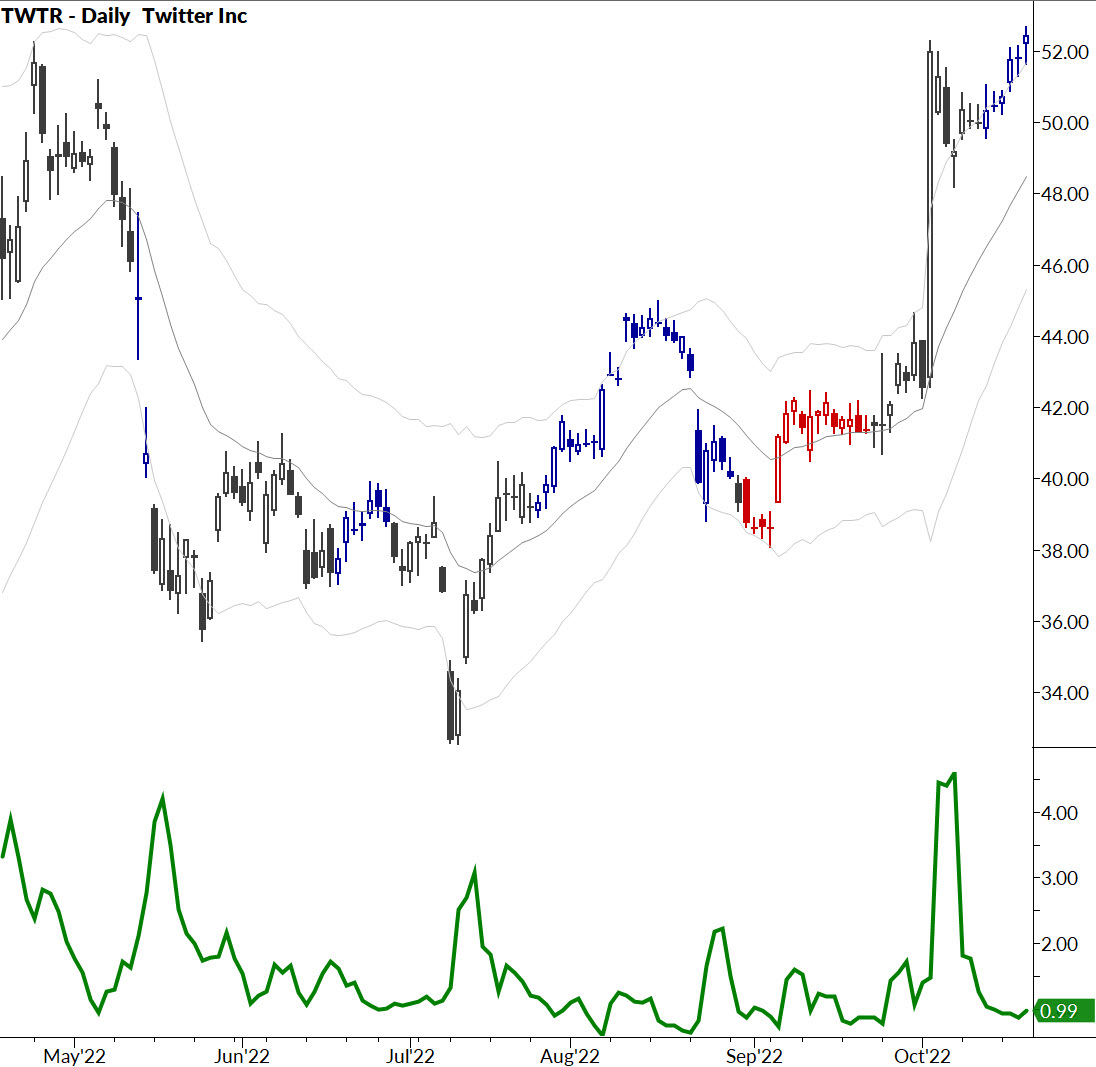
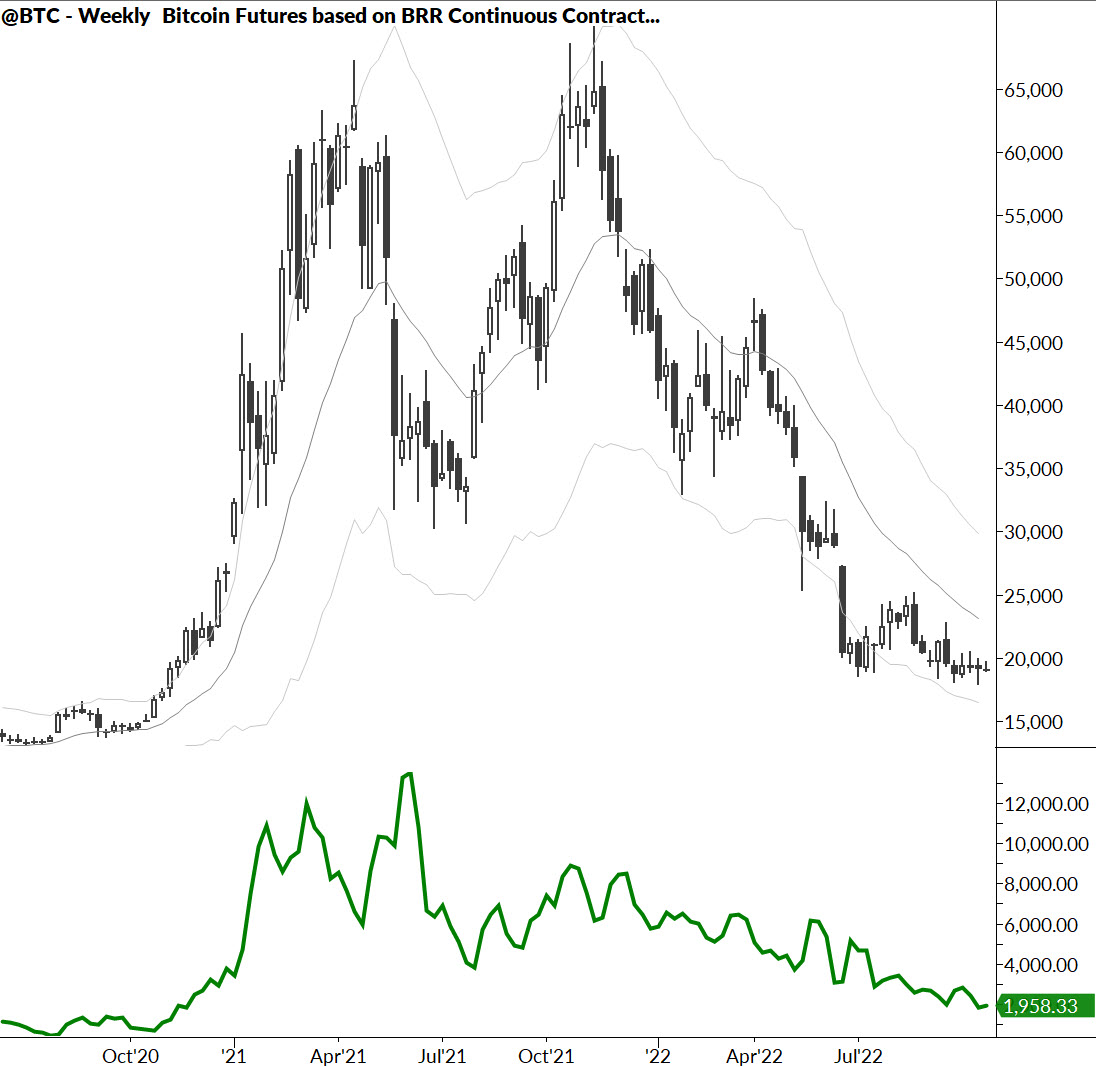
None of this is as esoteric as it seems. Take a look at a handful of charts below, which all show markets currently in a bit of volatility compression on these timeframes. Astute traders stand ready to take on risk when the volatility cycle shifts, knowing they are likely at the very beginning of a wave that will crest somewhere in the unknowable future.
But, by that time, we will likely have taken our profits and be looking for the next trade!