The Worst Thing That a Daytrader Can Do

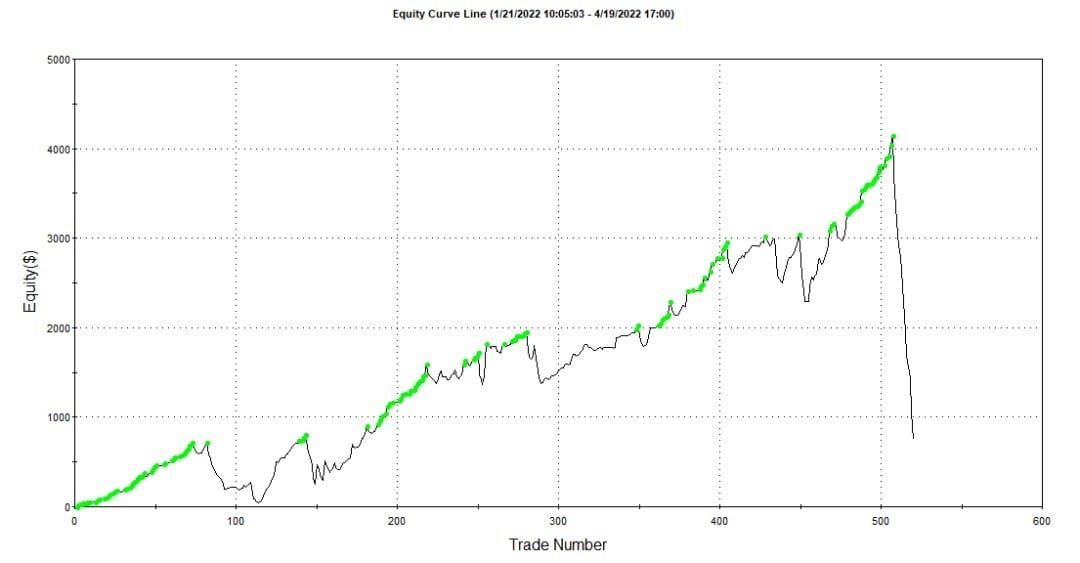
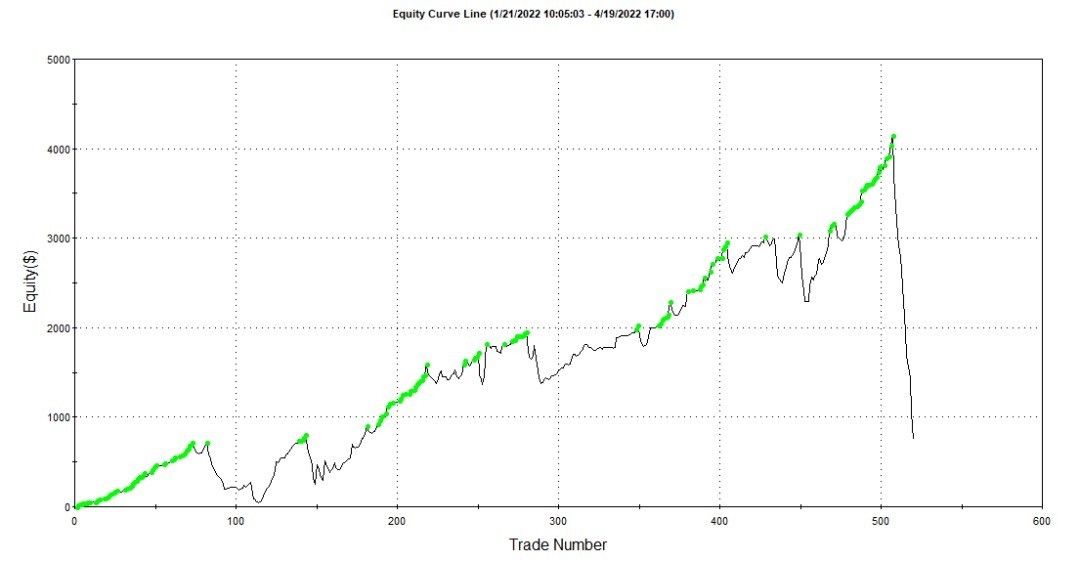
Yesterday, a trader I have worked with a bit over the years (let’s call him M) pinged me with this real-money equity curve:

(For the record, that's a pretty good equity curve, aside from the last trades. (I'd also ask some questions about the nearly 100% drawdown at the beginning, but that might not be fatal.))
This curve represents his daytrading from, roughly, the beginning of the year. These are real-money, executed trades--not a backtest and nothing theoretical. The x-axis is trade number rather than time, but what this curve shows is that he destroyed all of his profits, and very nearly his entire account, in the space of a single trading day.
His assessment of the day was succinct: “I just got rekt today” Yes, my friend, you did indeed, but let’s dig deeper. We’re going to approach this from two perspectives: 1) the market analysis piece (which M got 100% right) and 2) the behavioral aspect (which he got 100% wrong).
So, as we talked more, his approach is to fade the highs and lows of the S&P futures, and to add when it goes against him. (For those of you who are shrieking and pointing quivering fingers at your computer screen whilst screeching “NEVER ADD TO A LOSING TRADE”... relax. First of all, you’re wrong. There are styles that demand we add to a losing trade, and this is one of those styles. This is a viable approach, at its core.)
Market analysis for daytraders
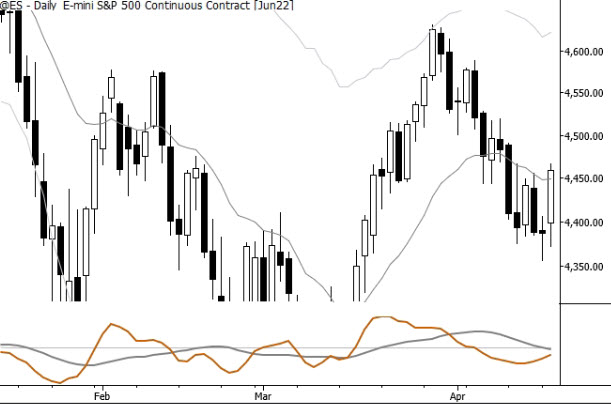
Take a look at the daily chart of the S&P futures. (But imagine the last bar is missing… so you are doing analysis before this bar.) What might you have seen?

Very broadly speaking, there are two approaches to daytrading: a “go with” approach that looks to ride trends or a “go against” approach that looks to fade them. Both can be profitable, but they have radically different risks and equity curves. “Go against” trading styles are probably more common. (And example of this would be shorting the high of the day and buying the low, or perhaps shorting the upper Bollinger Band or Keltner Channel and buying the lower.) The problem with “go against” styles is that they build consistent equity curves, but have the potential to give back hundreds of trades’ P&L in a single losing trade.
So, if you’re a daytrader, your first job is to attempt to say if the following day is more likely to be a mean-reverting day or a trend day. This cannot be done with 100% accuracy, but we can do it with a fair degree of reliability. In this case, take a look at M’s premarket analysis, written before the market opened:

So, he nailed it… absolutely nailed it. He had, from working through the materials I’ve put out there, identified some key elements that tilted the scales in favor of a trend day:
- Narrow range day
- Doji
- Failed overnight breakouts
All of this pointed to a market that was primed to trend, as he identified in “if we rally up in the open and take out yesterday’s high; We will be looking for a trend day to the upside.”
The market did rally up and take out the previous day’s high, and he was short and kept shorting. Why?
Human behavior
Trading is a game where you get paid for doing the right things. It doesn’t matter what you think, believe, or feel–all that matters is you execute your buys, on average, at lower prices than your sells. All that matters is when you push the button.
It’s really hard to find a trading methodology with an edge you can execute. (I often quote Jack Schwager who said something like “There are thousands of ways to make money in the markets. The irony is that they are all hard to find.”) Leaving aside, for now, the reasons why that strange statement is true, and assuming you do have a methodology with an edge–there’s still a gap from methodology to execution, and here be dragons.
Another way to say this is that there’s a big difference between knowing the right thing to do and doing it. In this case, M knew that a trend day to the upside was likely, and yet he shorted into that trend. This is the cardinal mistake of daytraders, and the worst possible thing you can do: do not fade a trend day. This is the mistake that will take you out of the game… not just for the day, maybe for life.
So this is why so much of our focus as daytraders is on finding the probability of a trend day. (These are relatively rare; only a handful each month.) Now, what what M’s ultimate problem? His assessment to me was that he didn’t follow his plan. Had he followed his exit strategy, the loss would have been perhaps a third of what it was–still a pretty bad rip, but recoverable. I would argue that the mistake was more fundamental: he found himself shorting when his setup for the day indicated a possibility of a trend day up.
The market is unforgiving. Contrary to all the scammers who tell you how easy trading is (and another scammer was successful taken by the SEC this week!), trading is one of the hardest things humans can do. And we are punished ruthlessly for our mistakes. It’s not like you get on a wrestling mat and tap out when your opponent gets you in a hold. No, that’s not the way the market works. The market disclocates your shoulder, breaks your elbow, and then starts punching you in the face, with a few kicks to the soft parts for good measure. And, as a final insult, the market will rub its sweaty ass in your face, just to make sure you know what happened! That’s the experience of being on the wrong side of a trend day.
Takeaway lessons here:
- if you are a “go against” daytrader you must 1) have a good methodology for identifying when the market is likely to trend (which will be a bad day for your strategy), and clear criteria for identifying when you’re on the wrong side of a trend day before you destroy 300 winning trades with a single losing trade.
- you can't depend on making it up as you go. Concrete rules are needed because psychological stresses will cloud your ability to read the market in real time.
- and it's great you have rules... but nothing matters if you don't follow them. Follow your f*cking rules. Every. Time.


