I’ve spent many hours over the past few weeks talking with my research clients on the phone. (I think this is an important part of what we do at Waverly Advisors–we don’t sell a “newsletter” or “service”; we have clients and those people are important to us, so we find the time, several times a year, to have conversations with them.) These calls are helpful for me because it gives me a little more insight into where people are focusing. Of course, some things were no surprise–people want to know about the Fed, impact of rate hikes, and the big question of whether this is a healthy pullback in stocks or the beginning of something bigger. What surprised me, however, was how often the question of stock market seasonality came up.
We deal with this question in the last quarter of the year every year. I’ve written some in-depth blogs in the past (a video here, here, and here, for instance), and I found myself having some conversations about significance testing (and the limitations of those tests.) Rather than dig into a math lesson here, I thought it might be productive to approach the problem from another perspective.
Whenever anyone presents you with market stats, the key question is “how likely is this to affect the future?” All other questions are really variations of that question. Sometimes people will throw out stats with arguments like “you can’t argue with math”, but it’s not really about the math, is it? It’s about the conclusions and implications we draw from the math, and that is certainly open to interpretation.
Patterns could exist for two reasons: 1) they point to something real in the data or 2) they simply arise due to random variation in the data. One of the best ways to build intuition about this concept is to create some simulations that are totally random–we know there is no actual influence and we know that each datapoint is basically a coin flip. Given those facts, let’s see what kind of patterns we can find in the data, and then compare those patterns to what we see in the real market data. If nothing else, it will give us new respect for how random data can appear to be non-random.
First, let’s look at the question of weekly seasonality in the S&P 500 index over the last 10 years. A good place to start is simply asking how many times a particular week (we could do the same thing with months, days, or any other time division) has been positive over those 10 years. Here’s one way to do it:
- First, we take weekly data for the S&P 500 for the past 10 years, and number the weeks 1-53. (There are 53 numbered weeks in some years.)
- Let’s then do a very simple analysis and score each week 1 if it was positive and 0 if not. (We are lumping unchanged weeks into down weeks, but that’s ok for simplicity.)
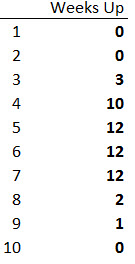
- For each week of the year, count the number that were up. (Call these “UP#”, just for reference.) We find, for instance, that week 1 was up 4/10 times, week 2 was positive 7/10, etc.
- Last, count how many UP#s fall into the bins 1-10. In other words, how many weeks were up only 1 year out of the last 10? How many were up 5/10?
Here’s what this data looks like for the last 10 years of the S&P 500. Very interesting–we have some weeks that have been up 8 out of the last 10 years, and one that was “almost always up”, declining only one year out of the past 10.

Is this “best week of the year” something we should focus on? Maybe we should just trade that week, since it was up an astounding 9 times out of the past 10 years, right? Maybe also those two weeks that were up eight times in 10 years–perhaps we should load up leveraged risk on those weeks and go nuts, right?
Well, let’s think a bit deeper. There’s a chance that these results could be due to chance, and so a question we might ask is something like “how likely are we to see this kind of result if there is no actual seasonal influence?” Another way to phrase the same thing would be to assume that markets are completely random, and then to see how often we’d find a week that was up 9 times in the past 10 years, and we can easily play with this in Excel.
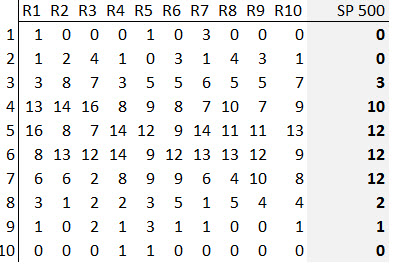
I made a simulation that created random weeks (based on return assumptions drawn from actual market data, but you could also do the same thing with a coin flip), and then did the same type of analysis. Here are the first ten runs (columns R1 – R10) I got from that simulation (with the actual market data on the right side.)

Now, think carefully about what this simulation is and how it works. Each week is basically a coin flip–there is no way to predict that any week, on any subsequent year, is more likely to be up or down, because they are random. However, if we were to do “seasonal analysis”, we might be tempted to focus on the “really good” weeks. Some of the runs have weeks that were up all 10 years, and most have a handful that were up 8 or 9 times out of the past 10 years. Though these apparent seasonals are there in the data, they arose purely due to chance, and have no ability to tell us anything about the future. Does the real market data look any different?
There are better statistical tools (e.g., significance tests) to answer this question, but I think a simulation is a simple way to help us build some intuition. In this case, it’s easy to flip the lesson around and apply to it the “worst weeks of the year”–there’s simply no good statistical work that supports any non-random seasonal influences in the market. Yes, anyone can naively count weeks and produce stats, sell research and get reblogs based on these bad stats, but they do investors and traders a disservice. If there is no predictive power to the stats, then there’s no sense analyzing them. One of the worst things we can do is to incorporate bad information into our analysis, but that’s the topic of this week’s podcast.


One of my pet peeves are all the ‘edges’ and ‘past stats’ sites which pick random conditions which happen to match today, and then calculate historical win rates of those conditions. To quote Max Gunther in the excellent Zurich Axioms, “if you can’t predict correctly, predict often”.
I agree. Absolutely stunning math illiteracy, and there are services (and plenty of bloggers) who simply search for stats to “share”. I imagine the damage done by this group to developing traders is much deeper than anyone would imagine. Btw, I had not read the Zurich Axioms, but put it on my Kindle to read soon. Thanks for pointing out something I should have read already!
I saw this tweet today and immediately thought of this blog post. Is this an example of a useless stat? [link removed]
I recently saw a stat posted by popular technician that says the 44th week (Nov 2-6 2015) of the year is tied with Christmas week for the most bullish week of the year. It immediately made me think of this blog post. Would this qualify as a misleading stat?
In my opinion, yes, that’s a solid example of the worst kind of potentially misleading stats. Rather than asking me, ask the poster what tests of statistical significance he thinks are important.. if there’s no clear answer, then ask the more general question about how he thinks about valid results vs results that appear just by chance.
It’s amazing how many commentators or services selling things to the public don’t think about these critical issues.
Hi Adam.
I’m all new to trading, and currently I am taking my time trying to understand different approaches to the market(s). Staying open, but also not mistaking opinions for certainties. I found your blog when listening through the podcasts at chat with traders. Thank you very much for sharing so much useful information,
and in a balanced manner.
I have a question about seasonality: In my country Norway, the biggest institutions each year present their new-year take off stocks yearly December. To me it looks like they hit fairly good, every year. And beating the index (OSEBX).
I have done some very (extremely) basic quantitatively work in Excel. The stocks they select and present are the ones that have had the most negative market development through the year. And then they make the list a bit shorter by some other method.
To me as a beginner, this is what an opportunity looks like. And my theories as to why they select the right equities are as follows:
1. The big institutions have a lot of followers who follows their lead (when presented with “new year stocks”).
2. Investors want to cut losses for tax reasons before new year, and this affects the price movement in this period.
3. Norway is a smaller and different market (compared to bigger markets) – and therefore seasonality have more truth to it.
I could be wrong in every one of these, or even all could be true.
Without looking further into this, and assuming I am truthful (to the best of my knowledge…) – would you consider the over-performance of the “new year stocks” to be random? Or would you recommend this is something I should dig into?
It would be really interesting to have your opinion on this, and I would greatly appreciate your answer.