Recent action in copper futures gives us some market lessons. These can be adapted to other markets and timeframes (so if you just trade stocks or currencies, don’t skip over this because it’s a futures market!) I’ll try to keep this as short as possible, but there are a few important lessons here. As you read, look for insight on:
- Measuring trend integrity through overextension
- Exhaust and climax moves
- Reading market strength by quality of pullback, or what happens after an exhaust
- How basic trading patterns can become tools for market analysis
Overextended trends
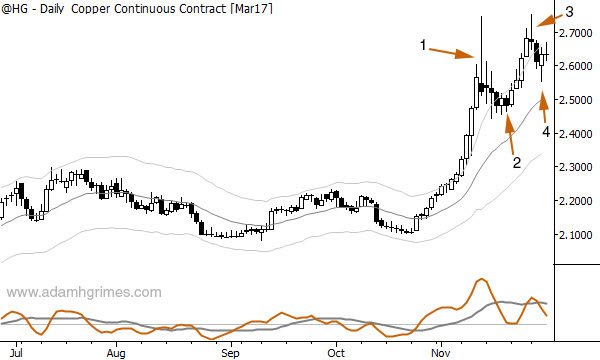
Let’s jump right in. Take a look at the copper chart below. Notice that, in the weeks leading up to (1), the market had been very strong, and eventually had pushed completely above the upper channel. (These are Keltner channels set 2.25 ATRs around a 20 period EMA.) In fact, a number of the bars were completely above the upper channel (low of bar > top of channel); I call these free bars and they are quite unusual, another confirmation of trend strength.

Of course, we have no idea how long a strong trend can go on, so we certainly don’t fade this move. It’s also hard to jump on board to the long side because volatility and risk are very high without strong odds on our side. So, we wait and watch. At (1) something interesting happens: this is classic exhaust, indicating that the short-term trend is probably done for now. The following factors play into this assessment:
- Previous trend was overextended
- Current bar’s range is much larger than previous bars
- Current bar’s close shows a failure of trend, closing near the low of the bar
The aftermath of a climax move
This bar at (1) changes things enough that we now know to pay attention. I still don’t think we have a trade, though really aggressive traders might short around the close of (1) with a stop around the high of the bar—not the best trade, in my opinion, but there’s a very good chance the market will collapse from that overextension.
This collapse can set up classic patterns like an anti or pullbacks in the nascent downtrend, but we can’t anticipate. We have to see what the market wants to tell us, and, in this case, the down move does not develop. On the contrary, the market holds together very well, and stabilizes after a minor selloff. At (2) I saw an opportunity for a long trade, buying an upside breakout. What factors contributed to this assessment?
- The failure of a strong down move to develop. This is the baseline expectation after a climactic move, so the lack of that move tells us something else might be going on.
- Volatility contraction—the market simply gets quiet around the pullback level.
- Inside bar: this can be a final trigger, justifying a breakout of that bar.
Trading a pullback after a climax move
Generally speaking, when trading pullbacks we want to give the market the benefit of the doubt. We want to give the trend a chance to work things out. However, things might be different following a climax, so we let the market context shape how we trade the move.
In particular, the bar marked (3) is a problem. This reads as a simple and classic failure test against the previous high, with the added impetus of the previous high being an exhaust. What do you do? Well, we have some choices, but the only real mistake would be to ignore what the market is telling you. Using a wide stop here doesn’t really make sense, as there’s now good reason for a short (e.g., entering on a breakdown of the low of (3)), and a probability that the market will collapse again.
So, we can either exit the long, exit part of the long, or, at least, tighten the stop aggressively. This, by the way, is consistent with the core idea of swing trading. People say ‘swing trading’ to mean they are not daytrading, but this is not quite correct; swing trading is a style of trading that looks to take one clean swing out of the market and to tolerate as little “give back” as possible. In this case, we were able to target a clean move from 2-3 on the chart, and that’s about all we can expect.
What next?
The right edge of the chart is more interesting and much more challenging than the middle. At (4), there are some conflicting patterns. We now have some type of double top with a climax bar up there, and have good reason to start leaning short. However, there has been no downside followthrough from (3), and, perhaps, we are setting up a similar situation to the bar at (2).
This is just one way to read the chart, but you can also see that the simple patterns of exhaustion, pullbacks, volatility contraction, inside bars, and failure tests are much more than trading patterns—if we watch how these patterns evolve, how they work, and when they fail, we have a complete toolset for reading market action as the dynamics of price action and emotion play out in any market, in any timeframe.


Excellent article Adam. It’s rare to see this type of article where you are walked through the person’s thinking. Nice description of the journey one makes in reading price action and of the choices offered. Of course, it’s always more difficult once you have a position on to be as objective to what the market is really telling you. Really enjoyed it.
The rules that you have mentioned could be coded and tested. It’s anecdotal until there is a sample size large enough to provide direct evidence that you have an edge. -thx
Pingback: More trading lessons from copper - Adam H Grimes