This is one of those technical questions that does not have a quick, simple answer. The best answer is “no, not really, and almost certainly not in the way most people think”, but there are some nuances to consider. I have done extensive quantitative work on moving averages, and the answers I have found challenge many of our ideas and many of the ways technicians use moving averages. Based on my work:
- There are no “special” moving averages. (I.e., the 200 day is not special compared to the 193, 204 or any other average.)
- Pricing crossing or touching a moving average does not have significance for future market direction.
- The slope of a moving average is not a meaningful indicator of trend.
- Crossings of moving averages are not meaningful indications of trends.
- Indicators built from moving averages are not reliable indicators of trend.
- In short, most of the things that traditional technical analysis teaches about moving averages do not stand up to quantitative scrutiny.
I can’t possibly share all of the work I have done in one blog post. I think it is bad form when someone tries to make a quantitative argument by saying “trust me”, (In fact, I just read a blog where blogger who did the same thing. He said “I’ve looked at the 200 day moving average and the market does better above it and worse below it. It works. Trust me.”), but I want to move us toward conclusions rather than getting lost in details today. We can revisit the details later, if there is interest.
The 200 day just broke. Now what?
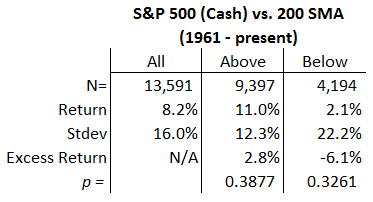
As I write this blog, major market averages have just crossed the 200 day moving average. Everyone is talking and writing about the historical streak of closes above that average, and has been watching for the momentous first close below. Since so much attention has been focused here, it’s only reasonable to ask what happens after a major stock index crosses the 200 day moving average. The table below shows the performance of the S&P 500 cash index, qualified by the market being above or below the 200 day moving average:

This table shows that the S&P average return has been 8.2% (annualized ((meaning that the daily return would compound to this number if annualized. It is a little bit easier to understand these numbers intuitive than to look at something like 30 bps))). Above the 200 day, the average return annualizes to 11.0%, but when the market is below the 200 day, the return is only 2.1%. This appears to be interesting (outperformance of 2.8% above, and underperformance of -6.1% below) until we consider the degree of noise in the data. ((I really need to write a post on significance testing. Please excuse my generalizations until I do so.)) The problem is that the size of the “effect” is quite weak; the effect we see here is quite likely to be due to luck of the draw. You could counter that this does not matter—after all the data does show this outperformance, whether it is statistically significant or not, but if it is not statistically significant, it is probably more difficult to rely on the effect in the future. If it is not statistically significant, there’s a decent chance we’re being misled by noise.
For the record, we see similar numbers with the DJIA (4.1% above (p = 0.16) and -7.7% (p = 13) below, using data back to 1925). Whatever effect there might be appears to fade in more recent data, as the last decade shows basically no difference above and below the 200 day for both indexes. Consider, also, that we should expect to see very similar numbers since these indexes are tightly correlated.
There are also a lot of bad statistics floating around. I have seen a number of people throwing around numbers like “the S&P 500 makes 23.5% above the moving average, and -19.5% below, so crossing the moving average means the market will be weak.” Can you guess where numbers like that come from? You got it, this error, counting the crossing day (which will nearly always be up for above and down for below) in the wrong category is enough to massively skew the stats. Be careful.
Unfortunately, this is not a crystal clear statistical answer; to really understand it we have to be able to think about significance, stationarity, and a few other concepts. Someone determined to believe in the 200 day could look at the results in the table above, ignore the significance tests, and say that there is an effect, even if it’s a small one. At the very least, we need to acknowledge that there is pretty much no effect for the last two decades, so maybe something changed between World War I and today, but, it’s difficult to justify the attention put on the 200 day moving average when we have much better tools that work much better.
Fading effect over time?
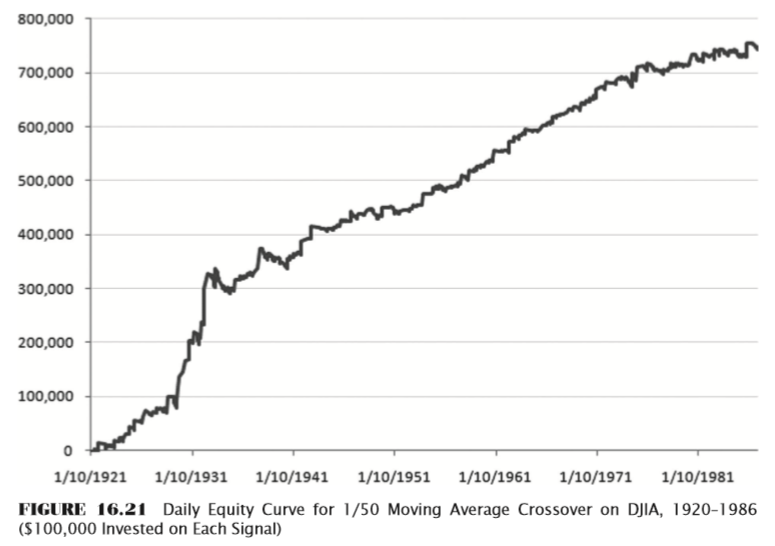
Here’s another illustration that shows the fading of the effect in recent decades. (This is drawn from the unpublished part of my book which had about 30 pages on moving averages with over 25 tables and figures.) I replicated one of the tests in the Brock, Lakonishok, and LeBaron’s landmark paper on technical trading signals((http://www.jstor.org/stable/2328994)). which was basically price crossing a 50 period SMA, and here are the results that correspond, roughly, to the time period they examined in their paper:
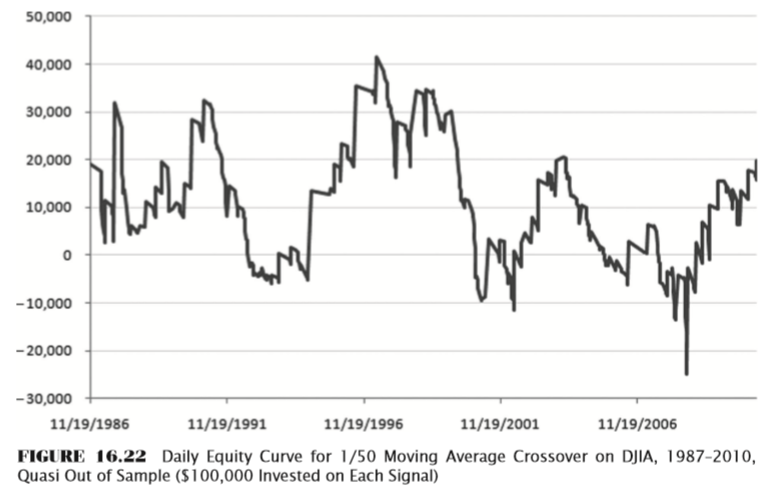
Pretty nice system, based on that equity curve. Also, think about the historical periods covered there: This system worked through the Great Depression, World War II, several recessions, shifting macro influences–and the equity curve just kept climbing. However, look at what happened if you’d traded the same system from then on:
 Not really what we’re looking for. There could be any number of explanations for this stark difference, but it warns us not to put too much attention (if any) on moving average crosses.
Some final thoughts
This post has only examined two moving averages on two stock indexes. Though the results are not crystal clear, it is at least obvious that there is no strong effect from price crossing the 200 day moving average. (I’ll follow up soon with a post that looks at other assets and other averages.) There really appears to be no effect at all, and I think there is a dissonance here that demands resolution: how can a trader be aware of the quantitative tendencies, understand the statistics, and still pay attention to price crossing a moving average?
I can tell you my personal solution, but you will have to find your own: I never look at or pay any attention to the 50, 100, or 200 period moving averages, and I pretty much stop reading anything as soon as I see someone discussing a touch, crossing, or slope of one of those averages–my statistical work has strongly suggested that these tools have no power, and we have better tools. Just because you hear everyone talking about something, that does not mean it is useful, and it does not mean it works. Make your own choices, but make them with an awareness of the statistical tendencies at work in the market.


Hi Adam, great post as always.
I’m a believer in MAs (although I agree that the MA used doesn’t really matter) but I use them as a filter to determine the direction of trades I will take.
Question: Do you think impact is washed out by the inevitable mean reversion that occurs?
Thanks Steven,
I do think there are some legitimate uses of moving averages, and I’ll cover a few of those soon too.
What I wrote in the post I “know”… what I mean by that is that I have seen it in the data. (Usual disclaimers: maybe I missed something, made an error, looked at wrong data, etc.) Since you asked what I think, here’s what I think:
I think moving averages are meaningless prices and all the attention focused on this is simply because of cognitive bias attached visually to lines on the screen. So, I don’t think there’s any effect, per se, to wash out. What power they do have is in capturing trends. I think (key word: think) markets are switching regimes faster in recent decades (post on that coming soon) so that may be why the effect fades in recent data.
Mean reversion does play a part in this and I’ll show you at least one interesting way in another blog post soon.
Perhaps on their own but used in conjunction with complete strategies they can be extremely useful in increasing risk/adjusted returns. I have tested numerous strategies, but trend following and mean reversion, and all but one case (momentum leading into dividends) the use of some kind of MA filter is significantly beneficial. Anyway, enjoy your work and musings. look forward to more of the same.
imo youre making sense here, and one of the ways a ma seems to “work” is that returns are often more volatile below… so it makes sense this could have some impact on risk-adjusted pricing.
check out of sample for your system tests too, just to see.
good point. thx for the comment.
Guys have won Nobel Prizes on the basis that you are absolutely wrong.
Pingback: Wednesday links: the end of the relentless bid | Abnormal Returns
Pingback: The Whole Street’s Daily Wrap for 10/15/2014 | The Whole Street
Most people think crossing the 200 day MA is significant for short-term returns. I.e., a couple weeks. So until you test for short-term effects, I wouldn’t dismiss MAs as meaningless for traders.
Yes, most of my testing actually focuses on short-term returns. Make sure you understand that the returns here are annualized… not looking at a 12 month window from a crossing, but annualized daily returns. That test will also pick up short term effects… imagine, for instance, the MA crossing had a strong effect but it only lasted one day. If you think about it, you’ll see that would necessarily show up in the simple categorization of above/below I’ve done for returns. (If you doubt, look at the different I show between the ‘correct’ test and the ‘error’ in which you could the crossing day in the wrong category.)
So, to answer your question yes I’ve done that work, but the test as given will also capture what you’re looking for.
You test performance of all days under 200 DMA vs. all days over 200 DMA. How is that going to reveal what I am talking about, which is the short-term (e.g., 1-week) returns immediately after the event (MA cross) occurs? Yes, of course those days are in your dataset, but they represent a tiny fraction of it. Given only the data you supply, there could easily be a short-term effect (that could be, for example, offset by opposite performance for days very far from the 200 DMA).
So no, your numbers do not show anything either way as to whether there is a short-term effect after a 200 day MA cross. If you don’t want to run that test or don’t want to post the results, that’s fine. But don’t show extremely general numbers and assume you are also showing that a very specific effect does not exist.
As I said:
>Yes, most of my testing actually focuses on short-term returns
This is a test I’ve run many different ways and explicitly have looked at 1-20 day returns across a wide range of assets. Most of my work focuses on that, so it’s not that I don’t want to run the test–it’s that I have, and, as I said, I cannot post every possible permutation of test results in one blog post.
However, what I is also true: if there is a strong short-term effect it will skew the statistics enough that it also shows in the test as I presented it originally. Look at the effect of just including single day in error (read near the end of the original post). I think if you’ve looked at many results like this and seen the impact of a single strong day you would understand what I’m saying.
Bottom line: I’ve done the test and there’s also nothing there. These are not extremely general numbers.
If you have an issue with that, the data is available for free and you can crunch the numbers yourself pretty easily.
So you’ve (supposedly) done the relevant test to prove your thesis, but it’s too much effort to show the results. Great science…
Well, it’s a blog and not a peer-reviewed research paper. Also, there’s enough info in these posts (that I provide freely as a gift to the trading community) to understand the concepts and to do your own work, if you are so inclined. What more are you looking for?
I suggest you to look at the different such as:
The Trend is our Friend: Risk Parity, Momentum and Trend Following in
Global Asset Allocation (Clare et al., 2014) ;
A Quantitative Approach to Tactical Asset Allocation (Faber, 2013);
Relative Strength Strategies (Faber, 2010)
Thank you. I am familiar with all of those (have not read the 2014) and wrote this will full awareness of them. Thank you.
Hi Adam,
Interesting post. However I am having trouble reconciling some of your conclusions with the data/charts presented.
The table shows what seems (to me) to be an impressive difference between “above 200MA” and “below 200MA” and Buy and Hold case, especially if the averaging method was CAGR or geometric average over a span of 53 years. You characterize the difference in performance as “The problem is that the size of the “effect” is quite weak”. How large would that difference have to be to be considered strong ?
Please elaborate on what the “p” numbers signify. Since stock market returns do not fit a Normal distribution, I assume they do not represent a statistical measure applicable only to a Normal distribution. I am looking forward to your upcoming post on statistical significance testing and assume that it involves some form of Bootstrap ? Thanks
Jack B.
Well, as I said, if you’re determined to believe in the MA you will. The clearest difference is volatility above/below an average, but one thing that is clear is that the 200 day is no different than any other reasonably long term average. At the very least, it’s silly to focus on crossing an arbitrary line.
One of the biggest problems with the effect is the decay in recent years.
p-values are from a standard t-test, which is reasonably robust to violations of assumption of normality, especially with large sample sizes. That’s easiest to do in Excel, but I use KS for other applications and have also used some bootstrap but the problem is that the shape of the distribution is truly unknown.
You say ‘it’s difficult to justify the attention put on the 200 day moving average when we have much better tools that work much better.’ I agree, but could you just clarify in short what those better tools are? (just to confirm I’m on the same page). Thanks.
Well, pretty much everything else I focus on. I’ve been asked this question a few different ways so I will work on a “what I think works” post sometime in the near future. Good question. Thanks!
Hey Adam,
I’m a novice trader and I’m still trying to bend my mind around technical analysis and how it’s not all a bit random, clearly if people can make consistent money with a clear “strategy” it’s not that random anymore, what are you’re favorite tools to check on to before you go into a trade, do you use a fixed system or routine?
Ive read all about patterns and that jazz but I’m not to big a fan of it because it’s so open to interpretation applying it on a moving market is a pain, looking at a historic chart it’s peanuts.
I have been doing rather okay (making a profit instead of losing money) with just winging it, buying low selling high as my strategy, but I would like to get a grip at it.
Any advice & tips are welcome, I’m trying to go from I have a slight clue about what I’m doing to going yeah I know what’s up.
Kind Regards,
Thomas
ps: like your blog, nice reads!
Well, I think you are correct… it IS a bit random (or more than a bit.)
I need to write a post answering most of your questions, but it will probably be a week or so.
Good questions. Please remind me if I don’t write that post in 2 weeks.
Pingback: Artikel über Wirtschaft, Finanzen und Devisen - 19. Oktober 2014 | Pipsologie
Pingback: Top Newsstuffs (October 13-19) | The Buttonwood Tree
This is amazing and solve a problem I recognised in my trading just this morning. Good and thought provoking like always. Thanks.
🙂
Hi Adam, I was trying to reproduce your P-value and was wondering what the number observations were when you calculated the SE.
Thanks
200 day moving average or any long term MA “works” if it is a part of trading strategy. In my case, I go long or short (using futures contracts) whenever crossover occurs. Results are erratic only if I trade an Index or two. But if you trade using a large number of stocks, across different sectors, with different fundamentals, you get a surprisingly consistent, low volatility returns.
If a bunch of stocks offer 15% returns/year over a 10 year period, a 200 day SMA crossover strategy too will offer similar returns, but with lower volatility – because you have the ability to go short.
It’s only when you expect massive outperformance or magical returns, you will be disappointed.
Well, I’d argue that line of thinking misses the point I’m making. Just because a factor is part of a profitable strategy does not mean the factor itself is useful.
For what it’s worth 15% returns/year is a very high number for “a bunch of stocks”… seems odd. And my experience with strategies like you are suggesting contradicts yours, but if you’re getting 15% a year with low volatility with moving averages then continue doing what you’re doing.
Adam,
Let me clarify. 15% is not what a particular strategy gives in returns – I just used it to illustrate that returns from going long can be replicated with a long/short strategy too, with lower volatility. I trade Indian stocks, and back here, 15% is considered a conservative returns estimate 🙂
And yes, I do understand that just going long or short mechanically with a crossover strategy will result in whipsaws killing returns – obviously, one needs to do more. That’s why I mentioned that a long term moving average is just one important part of the trading system – not the complete trading system in itself.
I choose 200 day SMA because I think its widespread use acts as a self-fulfilling prophecy!
I am interested in evaluating a moving average strategy with fewer transactions, which the 200-day isn’t known for! Would the p-values be similar for a more long-term trading strategy such as the 10-month SMA preferred by Mebane Faber? (Basically the same as a 200-day moving average, but just evaluated once per month, on the last day of the month.)
When I was doing the testing I looked at very long and short term averages… so many different variations… and also on different timeframes. I would expect (guessing here) that weekly/monthly data is even less convincing because those returns are closer to random walk. Probably makes sense to essentially index and call it a day at that point. 🙂
But you certainly could have a rule to only evaluate the 200 day at the end of the month. I don’t think I looked at rules like that… I wouldn’t expect to find anything, but that’s the beauty of research… you never know.
There’s evidence of momentum/trend in the markets for periods as long as one year. Why would you say that monthly moving averages couldn’t capture some of this as better risk-adjusted returns?
Faber has tested X-month moving averages over 100 years of U.S. stock market data, and different asset classes, and I think even sectors and different countries. He generally shows it reducing volatility by about 30% while not decreasing returns that much over long periods. And the simple strategy performed excellent during your sample period above 1987-2010. However Faber never shows whether it’s statistically significant.
Most investment writers don’t touch the idea of statistical significance. However doesn’t the paper you cite above (Brock, Lakonishok, and LeBaron, 1992) show that moving averages have good p values? It seems to show they do statistically “work”! (at least historically)
Pingback: Fungerar 200 dagars medelvärde? | SAMUELSSONS RAPPORT
Pingback: 200-day Moving Average Trading Strategy – Allinthenewspapers
Pingback: 200 Day Moving Average Trading – Allinthenewspapers
Pingback: 200 dagars medelvärde – funkar det? | SAMUELSSONS RAPPORT
Pingback: 200 dagars medelvärde – funkar det? | Aktiefeed.se