The most important things
Sometimes, it’s hard to know where to start. When we look at charts or go to the market for trading ideas, thousands of pieces of information compete for our attention. In this post, I’ll share a look at some of the key technical factors I consider when making a trade—I think of these as the most important things on a chart.
The problem is that most of the information is, frankly, useless. Much of the information is overlapping, and most of it won’t move markets like people expect. Unless we can focus our attention on things which truly have the power to shape the future path of prices, we’re doomed to eventual failure.
Here are four things that help sort out good potential trading candidates from markets that should be avoided.
- Presence or absence of a longer-term trend
- Short-term volatility relative to longer-term volatility
- Any real support and resistance levels nearby
- Meaningful short-term patterns
Let's look at these one at a time:
Longer-term trend
The presence or absence of a trend is clearly one of the most important factors in financial markets. We're not suggesting a naive approach of "following the trend", but knowing whether there's a trend or not will help you avoid markets that are chopping around randomly. Knowing whether you are trading in alignment or against an existing trend has important implications for trade management.
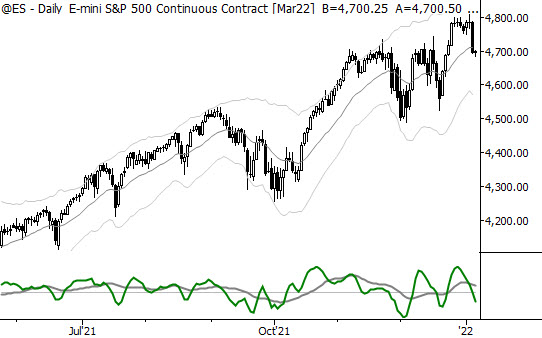
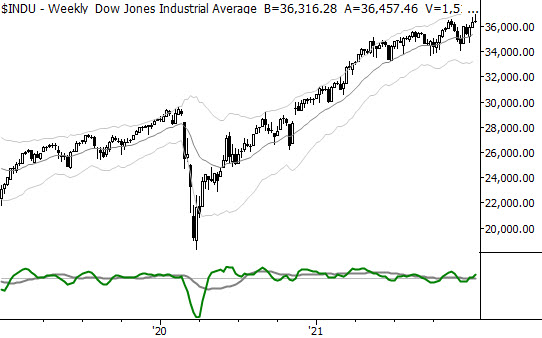
Fortunately, it's not too hard to identify trending and non-trending markets! We can look at a higher timeframe chart, but we can also simply look at a chart and note if prices are moving up or down, or if they are relatively flat. Here's a market with a good uptrend:
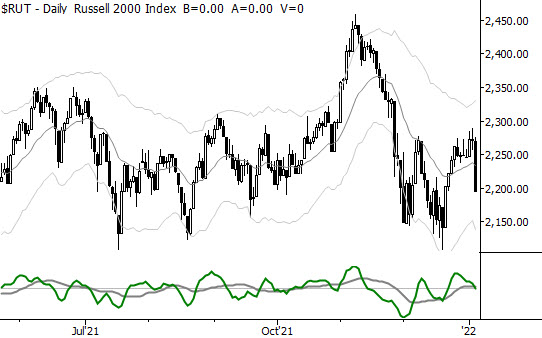
Here's a market that's relatively flat, and would probably offer frustrating trading for most styles:
Recent volatility in context
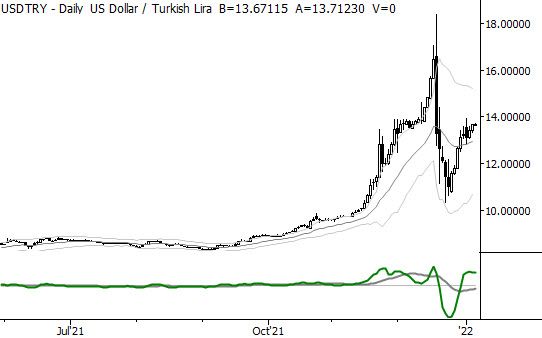
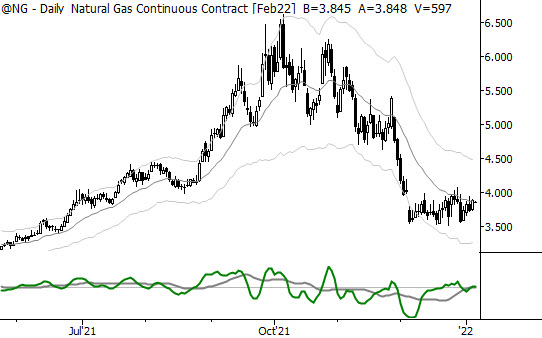
Volatility is just a number. By itself, it doesn't really tell us much, but knowing if a market has recently become more or less volatile can give us significant insight about what comes next. To a very real extent, any trade is a forecast on future volatility conditions. Here's an example of a market which has recently become much more volatile:
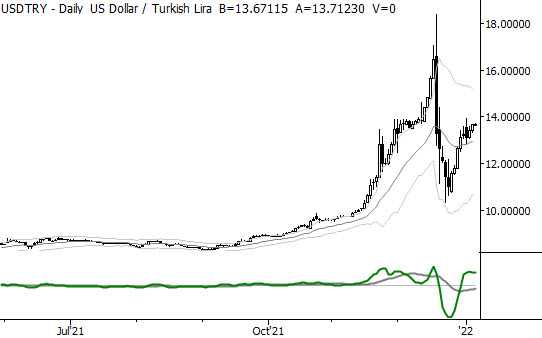
And here's a market where recent volatility may be drying up:
Trading this aspect of a market isn't necessarily simple, but understanding what's likely to happen to volatility in the near future can give us some hints about how that market might move--certain conditions can give us an edge for clean moves, for extended moves, or sometimes tilt in the favor of failure.
And here's another nugget: a quick shift in volatility, such as new momentum out of a consolidation, does have a quantifiable edge for continuation.
Support and resistance
I know it's an extremely unpopular opinion with much of the social media trading universe, but my trading experience and quantitative testing has led me to a firm conclusion: support and resistance just don't work like people think. Most levels where people expect support and resistance are meaningless, and you can't trust your subjective sense of what works.
However, some levels are real and powerful. A short list of the levels we pay careful attention to:
- All-time highs/lows
- Yearly highs/lows
- Visible and obvious chart points
- Our PowerLevels
Action around these levels can often be revealing, and some of them (for instance, 52-week highs) have clearly quantifiable tendencies. (Note that there are also followup trades here, as some of them have tendencies in both directions, depending on how long ago they were touched.) When we see a market continually making all-time highs, this tells us something:
Short-term patterns
These can be complicated because this is where everyone wants to start. Newer traders (quite reasonably) say, "Just show me patterns that tell me where the market is going to go!" The problem is that these patterns are most meaningful when they are placed in context, and each one has their time and place.
Here's a list of some of the patterns we do find meaningful. Some of these cover 2-3 bars, and some are a bit bigger:
- Flags or consolidations
- Nested flags
- Quick "up/down" trend climaxes
- Antis
- Our standard trend termination patterns
- Little patterns such as NR7, ID/NR5, etc.
How to use these
Next time you look at a chart, try using this framework. It does take some time and experience (for instance, to understand short-term patterns or inflections in volatility), but working through a quick checklist like this can probably add to whatever you are already doing, and may even show you some new directions for profitability.


