I want to share the results of a quick statistical study I did today, and also share a few thoughts about using stats, in general, to shape our trading decisions. (And I promise two things: this won’t be a boring blog and if you trade actively, it will give you something to use this week!)
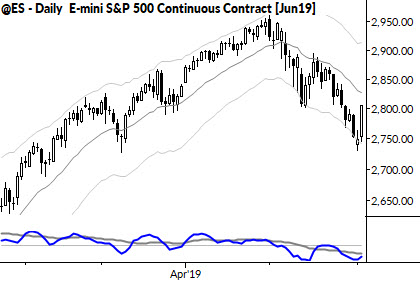
After some fairly sustained selling pressure, the stock market snapped back today. (See chart above.) My assumption was that this pattern was pretty bullish, but how do we test that?
Here’s the big secret about statistical work: the answer you get is an answer to a very specific question. The question might or might not be the right question, and there’s really no way to know that. Ask the wrong question, you’ll get the right answer to your question, but, ultimately, the wrong answer to reality. So this is always a danger, and there are at least two parts to the solution:
- Keep your question as simple as possible. If you add more than 3 conditions, you’re in danger.
- Avoid multiple “cuts” through the data. Meaning, if you get an answer you don’t like, don’t refine the question until you get an answer you do like!
So I asked “what happens after the market has been extended downward for a while [yesterday closed under the lower Keltner channel] and today snaps back hard [today is a >+2.0 sigma up close]?” My assumption was that we would see strong bullish followthrough from this pattern.
So I went and asked the data, and I was wrong. I found that tomorrow only closed higher about 45% of the time (vs. about 53% of the time on any random day), and with a negative average return. Now, I know that the market tends to mean revert, so if we buy the close of any up day we will lose a little money, but I had assumed the overextension to the downside might select a set of snapbacks where we saw some continuation. I was wrong in that assumption–the basic snapback, mean reversion wins.
Then I thought: “oh wait, maybe the bear market in 2007-2009 killed this…” So I added one condition (which should create a flashing warning sign in your head–I’m taking a second cut through my results!): let’s only take this entry if we are in the upper 50th percentile of the trailing yearly range. This will knock out the worst bear market environments…
So what happened? The numbers got worse! We are now up 23% of the time tomorrow, based on these conditions… These are pretty overwhelmingly bearish stats, and yet, perhaps paradoxically… I’m still leaning long tomorrow.
I’ll leave you to unpuzzle the why, but the clue has to do with the character of the followthrough. My sense is that this setup is quite different from most of the other times this pattern has occurred, and there’s one important thing that must be included in our thinking.
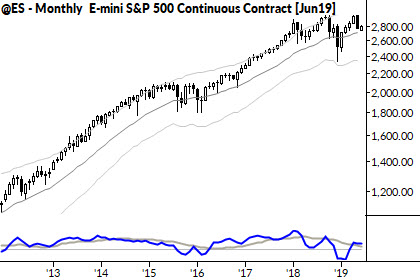
That’s a chart of the S&P 500 on a monthly basis, just to illustrate the point: this is a bull market. Despite all the social media “traders” calling for crashes, all the hand-wringing over every nuance of economic data (which is meaningless, at this point in time), and the excitement of the permabears on every 5% drop–this is still a bull market. And the S&P is less than 6% off it’s all time high=not particularly bearish.
If you trade stocks, you ignore that at your peril.
The followthrough of the next few days will tell us a lot. Here are the other dates that fulfill this condition in the backtest. It is probably worth 15 minutes of your time to look at them, and to carefully consider what has happened in the few days after.
10/28/1997, 9/8/1998, 4/21/2005, 11/13/2007, 5/10/2010, 5/21/2012, 12/17/2014, 9/12/2016, 11/7/2016, 3/26/2018, 10/16/2018, 6/4/2019
There’s a potentially powerful trading idea here, and I’ll try to write more about it in a few weeks.