Using highs and lows
How do we know how that market is doing on any day? If we turn on the news, we will hear something like “the Dow Jones is up 40 points…”, but this doesn’t really tell us what we need to know.
It would (obviously) be better if this information were delivered in the form of a percent change on the day, or even better if a volatility-adjusted measure, but what if we want to go deeper?
The questions we are trying to answer are more like, “how important is this move?” “Does it matter?” “Does this change anything?”
To answer these questions, we need to understand something about how markets usually move, and watch for things that are outside of these ranges. Some of the best tools will already be familiar to intraday traders.
Tools from intraday traders
Longer-term traders (holding days to months to years) often think the day-to-day moves of the market should be ignored. This is often true for traders on longer timeframes, but how do we know when we do need to pay attention?
How do we know when something really matters?
I’ll share two ideas here today:
- On any day, the best assessment of a market’s strength or weakness comes from looking at how it’s moving off the open (rather than the previous day’s close).
- The previous day’s high and low are critically important.
Previous high/low
The previous day’s high and low are always levels you should know. (Both in the broad market and in whatever you are trading.)
These levels mark points at which the battle was lost, for bulls and bears, and the market turned away. (Yes, there’s possibly an element of random movement at times, but this evens out if we use this tool consistently.)
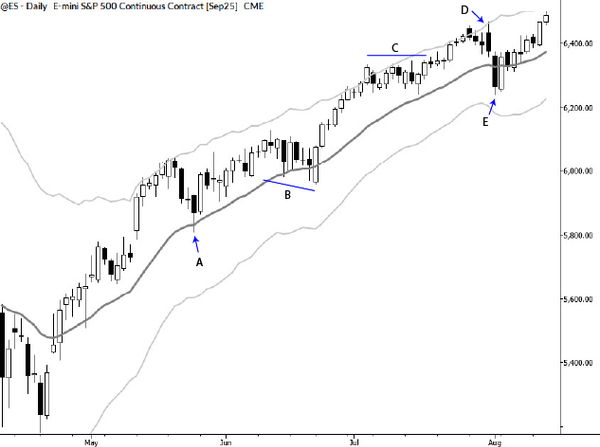
Consider the chart above:
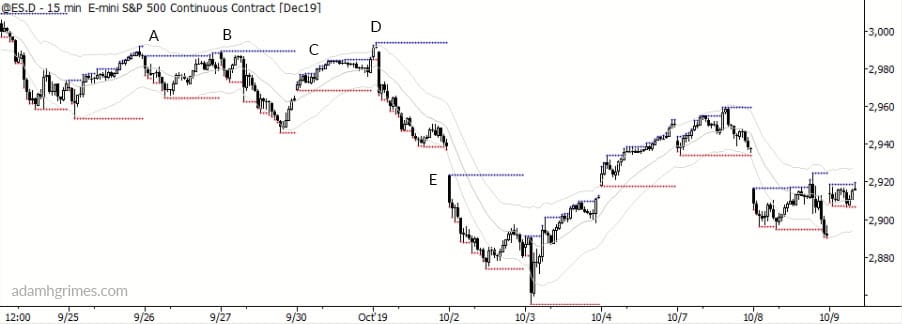
- A: The previous day’s high held, but price returned to the (current day’s) open at close. This is a day that shows a lot of bullish pressure.
- B: The high once again held, but we took out two days’ lows. Trading short intraday through those lows was a realistic trade. No clear bias end of day.
- C: Most of the day was an inside day (a concept which clearly refers to previous day’s range), but ending at the highs is a great bullish setup for a trend day tomorrow…
- D: Which was quickly frustrated by strong momentum off the open. Within a few minutes, pressure was accumulating against the previous day’s low, setting up a short on a break of that level. Note that the second day back’s low more or less held.
- E: Gap openings matter, but that’s another post…
These concepts aren’t the answer to every question. They won’t clear up all confusion. (For one thing, the market is sometimes confused, itself!)
But armed with this perspective, the longer-term trader can better assess market action on any given day. Timing entries, knowing when to hold and when to exit—all of this is much easier with some clear guidelines.
And, for intraday traders, you can build a reliable trading program around these simple concepts.