Trading Pattern: the Failure Test
[dc]I[/dc] want to do a small series of posts looking at some of the most important trading patterns I've used over the years. Rather than go in-depth with multiple examples, I'll keep these posts as a high level, introductory overview and will focus only on the most important points of the patterns I've found most useful in my own trading. Today, let's begin with the failure test.
There are many names for this pattern. Victor Sperandeo immortalized in his excellent books (here

and here

) as the "2B" pattern, and many other authors have since used that name. Wyckoff used slightly more confusing terminology, calling a failure test below support a spring (prices "spring" back above support) and a failure test below resistance and upthrust. (The latter term is confusing, but prices "thrust above" resistance and immediately failed. Furthermore, if you're interested in Wyckoff's work, this little volume

is an excellent introduction.) In The Art & Science of Technical Analysis

, I used the term failure test for trades both at support and resistance, in the interest of simplicity.

The failure test is a simple pattern. Take a look at Figure 1, which shows a theoretical market bouncing around in between support and resistance. At point A, prices poked above resistance, and immediately failed back below in a classic failure test or Wyckoff upthrust. (Don't worry about exact triggers or entries at this point, just understand the fundamental concept.) At point B, the market traded briefly below support, and quickly recovered back above, triggering another failure test (or a Wyckoff spring.) Note also that the short trade at A would have probably been very profitable, while a long trade entered at B might have been a loser. It's always important to build awareness of how patterns can resolve—both for and against the intended direction. In other words, study many examples of losing patterns.
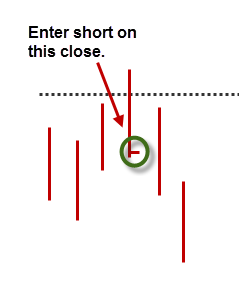
The best way to enter these failure test trades is often the simplest. Look for a point where price trades above resistance and immediately fails back below on the same bar, and enter short on that bar's close with a stop just above the high of that bar. (See figure 2.) It is also possible to enter on the following bar (i.e., a bar closes above resistance, but the next bar reverses and fails back below resistance); in all cases, the stop must go at or just beyond the new high set on the movement. For long entries, simply flip everything to a test below support and close back above. Conceptually, one of the main reasons markets exist is to create trading activity. Think about that for a minute--markets exist to create trading volume, so they will naturally seek out levels where there may be orders clustered. (This is also tied into the reasons that markets are essentially designed to cause traders to make mistakes.) Many of those forays to find volume will discover nothing more than a few stop orders with no conviction beyond the level. This pattern lets you take this potentially treacherous market tendency (to seek your stops) and turn it to your advantage with a tight entry against a clear risk point.
One final, and perhaps the most important consideration, is risk management. I tend to trade failure tests in two main contexts: in trading ranges, on pure tests of support or resistance; and in trends, as counter-trend entries—essentially an attempt to catch the reversal off the high of an uptrend or the low of a downtrend. Both of these situations are potentially risky: liquidity can be low in trading ranges, so it's not uncommon to have a gap opening against your positions. In trends, "gap and go" beyond the trend extreme (and, ahem, your stop) is also a possibility, and these are gap openings that do not tend to reverse. You must be prepared to accept larger than expected losses on some subset of these trades, so I suggest trading them on smaller size and risk than most of your other setups. Also, if you have an adverse opening against your position, be prepared to take action, as things often only get much worse as the trading day goes on.
I'll follow up with a post tomorrow looking at some examples of this pattern in action.


