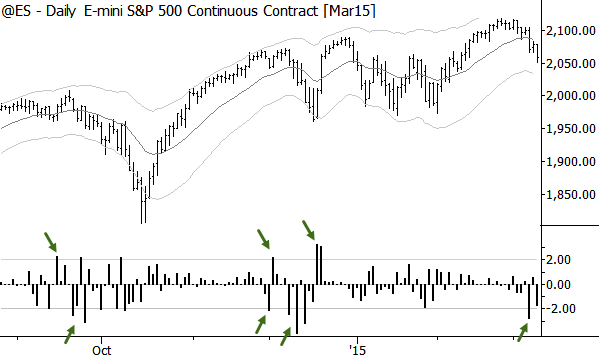
We can simplify many of the problems of technical or tactical trading to one question: assume that a market just made a large move. Do we want to fade (go against) that move, looking for reversal, or do we want to take a position with that move, looking for continuation? Most trading tools, patterns, systems, and analytics work toward answering that key question.
Markets are usually more or less efficient (in the academic sense of the word), meaning that current market prices generally reflect all available information, and most things are correctly priced nearly all that time. This means that most of the time, most price movements are random, and we have no business being involved in these markets. I think this is one of the mistakes that traditional technical analysis makes–in many schools of thought, there may not be enough respect for the idea that we simply have nothing to do in most markets most of the time. One of the core concepts of my book, is that every edge we have as traders comes from an imbalance of buying and selling pressure. Until we have that imbalance, we have nothing to do. How do we see the imbalance in the market? Often, because the market will make a large move, relative to its own recent price history, indicating that buyers or sellers have gained the upper hand.
Once we see that large move, suggesting the presence of an imbalance, we now can ask whether we should be going with that move or looking to go against. Another way to say the same thing is we are asking whether we expect momentum or mean reversion to dominate price movements in the near future. All of the millions of words written on technical analysis and quantitative trading simply to answering that one question! “A market just collapsed. Should we be looking to buy or short this thing?” That’s it–breakouts and pullbacks, or fading for reversal? Once we have that answer, we can take an appropriate position (with the appropriate risk), put in the right stop (if using stops), and manage the trade according to our trading rules.
Remember, everything we do will only work within the bounds of probability. We can’t predict with any certainty, but there are some ideas that will tell us if the move is more likely to continue or to reverse.
Tilt in favor of continuation:
- Breaks from volatility contraction
- Action following the break: consolidation near the extreme (low) often suggests continuation
- Pullbacks and consolidations on lower timeframes
Tilt in favor of reversal:
- Breaks from “normal” volatility conditions tend to be reversed
- Some markets (stocks) tend to mean-revert more strongly
- Good reversals are usually quick to happen. The longer it takes, the more the scales start tipping toward continuation.
- In extended trends, sudden expansion in the direction of the trend can indicate a “last gasp” exhaustion. Note that many traders are tricked into looking for continuation, thinking the trend will never end.
We can see a few simple themes here: low volatility conditions set up an environment where momentum leads to more momentum. If the move is going to fail, it should happen quickly. We also have to know the characteristics of the market and the timeframe we are trading, because all assets do not trade alike. We also can assess the length and strength of the current trend, and be on guard for a sudden, sharp movement in the direction of the trend, as that often indicators exhaustion.

As an exercise, look at the daily chart of the S&P 500 index above. The graph below the price chart shows each day’s move, expressed as a standard deviation of the previous 20 trading days. Moves +/- 2 stdevs are marked as large moves on the chart. Consider these moves in context of the ideas in this article. Which led to continuation and which to reversal? Were there any factors that might have tipped the scales in favor of one or the other? Did it work all the time? Answering these questions will get you most of the way to creating a profitable trading methodology.
Excellent.
Thank you!