One of the features of financial markets is that they often react to new information with emotional volatility, and overshoot extremes. Understanding this element of price behavior can give us good insight into future direction and even some specific trade setups.
Efficient Markets Hypothesis
One of the enduring points of confusion is that academic finance teaches that markets are, more or less, “informationally efficient”. Practically, what this means is that all information is correctly reflected in the price of an asset, and so there are no opportunities for trading profits.
Every year, an army of students graduates from our top (and not-so-top) educational institutions, having this concept drilled into their brains. If one were inclined to think cynically, we might note that this doctrine is actually the best possible marketing material for the ever-growing ETF industry.
If we believed in the Efficient Markets Hypothesis (EMH) we would have no reason to ever trade. And, to be perfectly honest, it does describe the majority of market action—in most cases, there is no reason to place a trade or to take on risk. But the devil is in the details, as they say, and emotional overshoots are one heck of a detail for the EMH folks to miss!
New Information
For traders who start trading looking at charts, it’s sometimes jarring to hear the idea that the market’s job is to take a look at all available information, incorporate new information when it comes along, and give a price that reflects what the thing “should” be worth. But that’s a pretty valid economic framework for markets, so give it some thought if it’s new to you.
Once you’ve accepted that, it’s obvious that when new information comes into the market, a repricing might be in order. That new information could be something like:
- Earnings for a stock
- A change in interest rates
- A crop report for a grain
- The start or end of a war
- Etc…
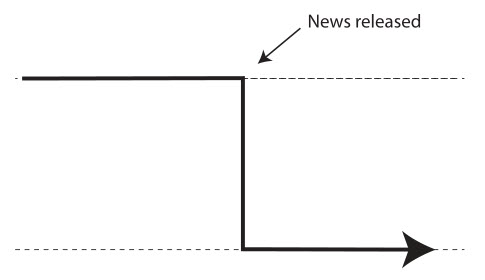
Here’s what the EMH folks pretend happens. New information hits the market and… boom… the market immediately moves to the right price. That price chart would look something like this:
In reality, what we see far more often is something like this:
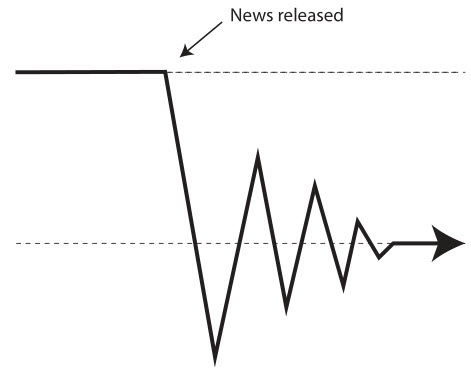
The market often goes too far, or not far enough, and bounces around a bit before settling in at the new, “correct” price.
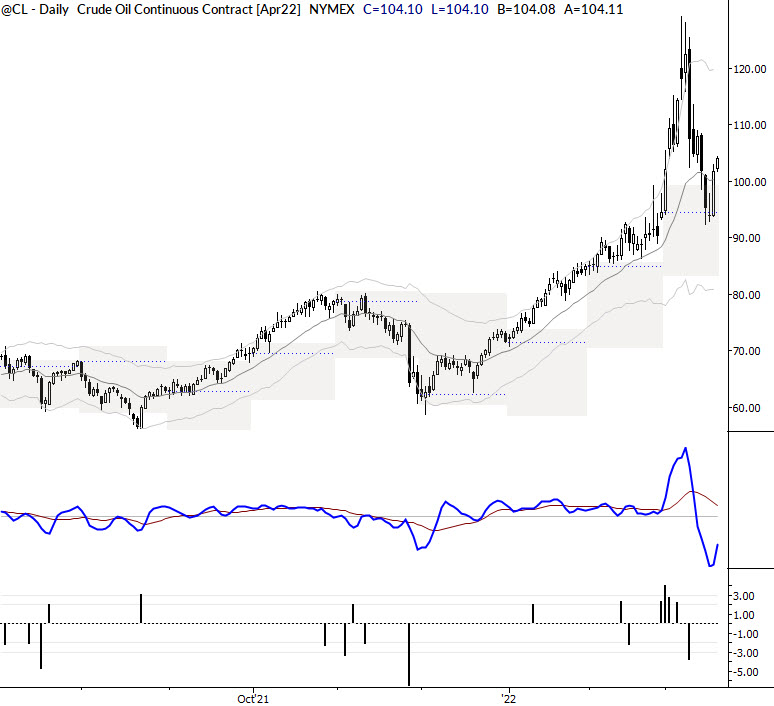
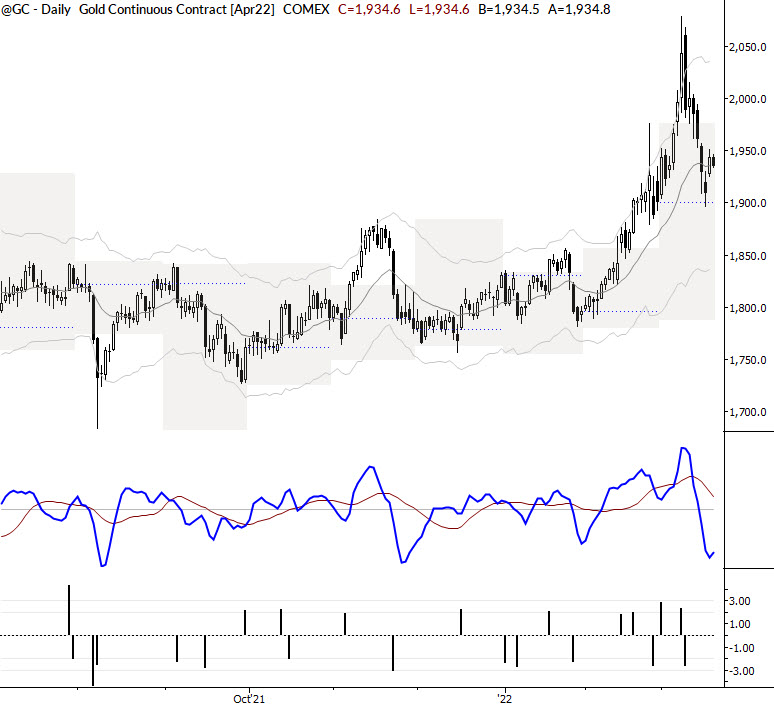
Overshoots on Charts
These emotional overshoots create some specific patterns on charts. Here’s a brief outline of what to look for:
- They usually come in already-established trends. There’s another kind of overshoot that comes from a sideways range (and this becomes a failed breakout), but the dynamics of an established trend are easier to read.
- The trend will accelerate. Old-school technical analysts would use the term “parabolic”, but that’s a very imprecise use of a word with very specific meaning. One of the things you can watch for on a chart is that the trend will usually pull away from a moving average. Trendlines can be helpful, but they are perhaps more subjective.
- The trend acceleration will usually be accompanied by an increase in volatility, but the rate of trend will generally outpace volatility. Whew… that’s a mouthful… but what it means is that the chart will usually go outside your Keltner Channels or Bollinger Bands.
- The final stages of the trend will often see some very wide-range bars.
- Typically, bars before this final stage will look very strong (or weak, in the case of a downtrend), closing on their highs. The final high of the trend will often be a reversal bar, or, at least, a bar that does not close on its high.
- There are also variations of that pattern such as island reversals, inside bars that break the “wrong way”, but it’s a good place to start.
Take a look at these charts from recent market action and see if understanding overshoots might have helped you read these trend inflections better in real time. We will look at how to trade around (and after) these chart points in an upcoming blog post.