Markets Unlocked 11/7/2022: Time to pay attention to the yield curve

So, folks, there’s news: our yield curve model inverted (for the first time since 2007) on 10/27/22. While nearly everyone seems to be aware that the yield curve is inverted, it seems that few people understand the significance of this event.
What does an inverted yield curve mean to you?
I just did an hour-long presentation for our MarketLife members in which I looked at every time our yield curve model inverted in the 20th century. It was an interesting romp through a big pile of data—we looked at price charts and statistical tests to understand how the market has reacted to an inverted yield curve.
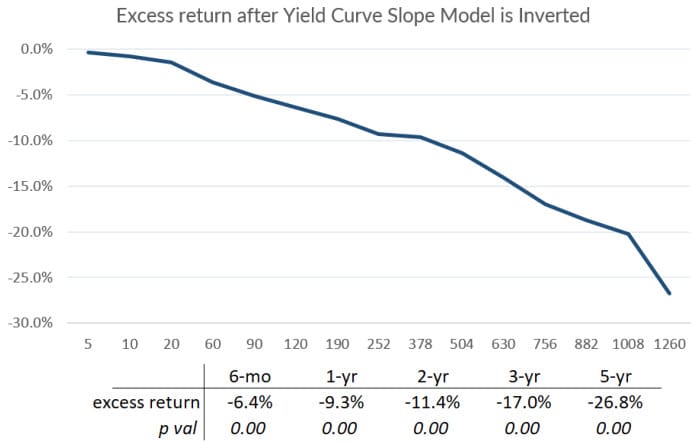
And the bottom line is simple: this has been a highly prescient indicator that has predicted extreme volatility and loss in the stock market with a very high degree of reliability.
Not recession forecasting!
Economists like to talk about forecasting recessions. To be blunt, I think this is an absolute waste of time. All that matters is how the stock market reacts. (As a short aside, you might wonder why economists don’t consider this. I think there are two reasons: first, much of what passes for economic analysis is actually marketing for index funds (i.e., the “you can’t time the market crowd”) and, second, the people doing the work are not active participants in the market.)
Fortunately, the much-vaunted ability of the yield curve to predict recessions also bleeds over to the stock market and the message is clear: when the yield curve inverts, watch out!
So what to do?
It’s certainly not my place to tell anyone else how to trade or to manage their investments, but I spent a good part of that presentation telling our members exactly what I, personally, am doing. It boils down to reducing (eliminating) long stock exposure and shifting to a defensive mindset for retirement accounts.
Assume the signal is valid and the market declines between 40% - 60% within the next 2-3 years. If you do nothing today and remain heavily invested, the best you can hope for is to not make a mistake—the best you can do is to weather the storm and not puke out your position at the lows.
But acting on this signal opens the door to many possibilities, including the chance to buy into real panic, when there’s “blood in the streets”. Acting to reduce exposure now allows you to buy at those points everyone else is making mistakes—it puts you in a position of strength rather than weakness.
Market wisdom
Take a look at the graph at the top of this post which shows the excess return after the points where the yield curve has inverted. (For this graph, back to 1950.) But put those statistics in this framework. Here are some words from Henry Clews, writing around 1890 in Twenty Eight Years in Wall Street:
“But few gain sufficient experience in Wall Street to command success until they reach that period of life in which they have one foot in the grave. When this time comes these old veterans of the Street usually spend long intervals of repose at their comfortable homes, and in times of panic…these old fellows will be seen in Wall Street, hobbling down on their canes to their brokers’ offices.
Then they always buy good stocks to the extent of their bank balances, which have been permitted to accumulate for just such an emergency… When the panic has spent its force, these old fellows… deposit their profits with their bankers… and retire for another season to the quietude of their splendid homes and the bosoms of their happy families."
Twenty Eight Years on Wall Street, Henry Clews, ca. 1888
There will be a time to break out the canes. We’ll be watching. Will you be ready?
The week ahead (potentially market-moving data releases)
- Monday: none
- Tuesday: none
- Wednesday: EIA Crude Oil Inventories
- Thursday: Jobs numbers, CPI
- Friday: none
Earnings season continues in full swing, with about 1500 names reporting this week.


