Chart of the Day: Breakout in the S&P 500
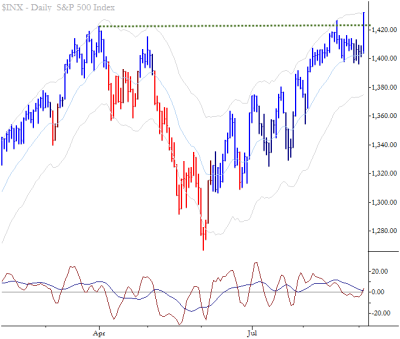
One of the tools I use to evaluate market action is the standard deviation spike, which expresses each day's return a standard deviation of the previous 20 trading days. (This tool is also discussed in The Art & Science of Technical Analysis

.) This gives an important perspective on market action—taken on nominal basis, yesterday's 2.0% rally was moderately impressive. However, on a volatility-adjusted basis, this was the largest upward close in the historical record for the S&P 500. This is extraordinary. What do we know about large upward closes? Look for a blog post this weekend, but the probabilities strongly favor higher prices in the intermediate term. Also worth considering is that this is a classic breakout from a consolidation against an important resistance level, following a failed failure test a few weeks ago. All of this is powerful evidence that the bulls are in control of this market.// < ![CDATA[ // < ![CDATA[ <span style="overflow:hidden;line-height:0px" data-mce-style="overflow:hidden;line-height:0px" id="mce_0_start" data-mce-type="bookmark"> // ]]>