Why Bitcoin was a clear short
On 4 December, I fired off a quick tweet that generated a lot of discussion in my Facebook and email inboxes. (Curiously enough, not so much discussion on the tweek itself.)
The tweet was just a quick snap of a daily and intraday chart of Bitcoin (BTCUSD) with the caption "A chart that practically screams 'short me'".
The chart below shows what has happened to BTC since that tweet, with the date of the tweet marked on both the daily and intraday charts.
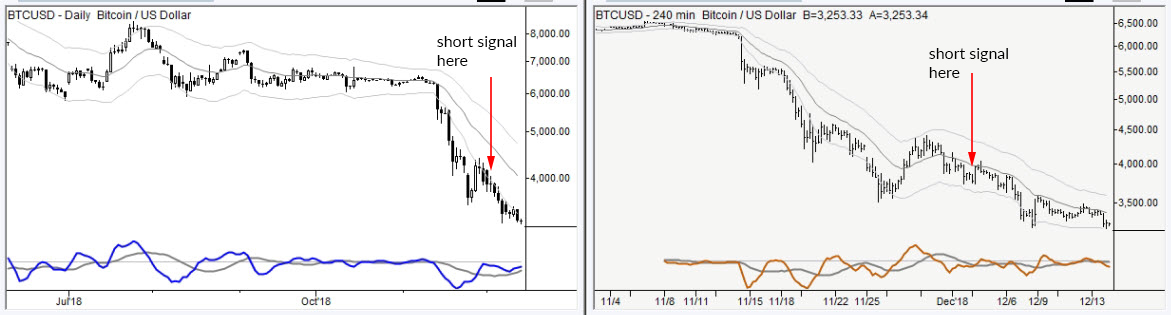
With BTC now roughly 16% lower, having melted down in an unbroken line, there are a few lessons to consider.
First, some assets attract particularly "low information" and poorly-informed traders and experts. Cryptocurrencies are perhaps the most blatant example of this we've seen in many years (but marijuana stocks are close behind--it's hard to respect anyone positioning themselves as an expert in either space.)
Why does this matter so much? Not to denigrate anyone else's work or intelligence, but because we need to realize that people speaking as experts 1) almost certainly do not have expertise, 2) are themselves likely highly emotional, and 3) are relying on you to be highly emotional. All three of those points are anathema to good trading--anyone who thinks like that can only make money when something goes straight up in bubble mode. When the bubble pops, they are left holding the bag.
Second, there were and are clear technical lessons here. I'll leave it to you to read further, but the relevant topics are:
- This was a simple pullback trade. MACD confirmed new momentum lows. Price pressed outside the channels and then retraced back inside. The momentum on both the setup leg and initial pullback were both a bit extreme, but that's also within the nature of an emotional asset like a crypto. In other words, this is a standard pattern you must know. I've written extensively on pullbacks because this is a pattern you can literally base your trading career on. Start here.
- Slide along the bands. We didn't know this pattern was coming, but it's important to recognize when it arises--it says important things about trade management, risk, and profit potential in the trade. (Google "Adam Grimes slide along the bands trend" for links.)
(I would gently say, if you were reading techncials and thought that BTC was a buy at that point, you need to reconsider the technical tools you are using and how you understand them.)
Any trade is just a tilt in probabilities, but this simple pattern can put the edge on your side time after time. If you're serious about digging deeply into patterns like this--why they set up, what they mean, how to trade them, how to manage the risk in them, and how to grow an account using technical patterns--start with my extensive, free trading course.
At the very least, start using pullbacks and trend structure to understand how markets move and what is most likely to happen in the future.


