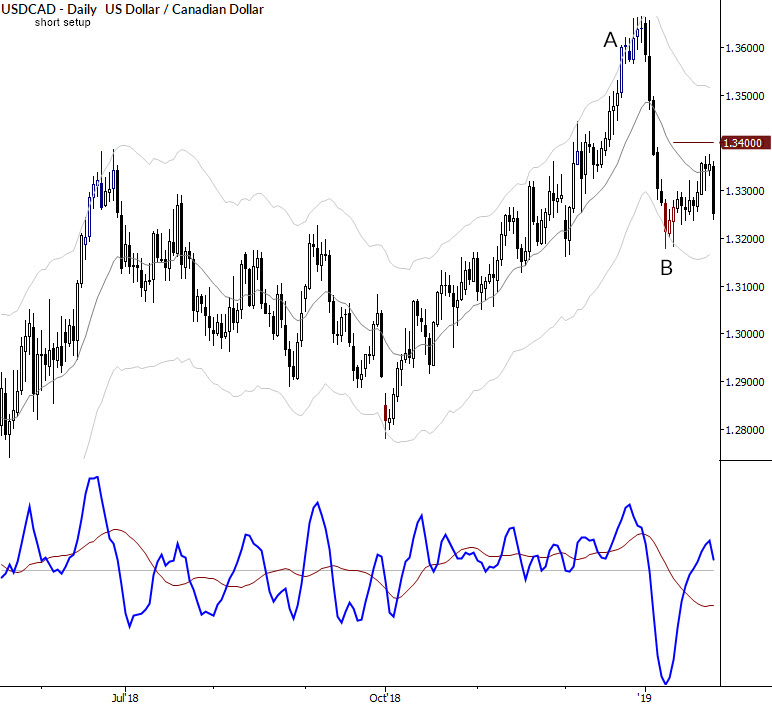
Just a quick post here, under the heading of “simple things work.” Take a look at the chart of the USDCAD below.
This is a picture perfect short setup, and there are several lessons we can take from it.
The setup
There are a few key components to the setup. We don’t really need to draw from other timeframes, so just looking at the daily as a standalone, we see.
- The USDCAD had been in an uptrend off the October lows
- This uptrend accelerated into a slight parabolic expansion. While not a clear buying climax (in fact, looking to put on long trades in a pullback from A would have been reasonable), the strong selloff following A puts the climax in proper context.
- To reiterate that point, price structures can often have several interpretations. What happens after a structure can give us additional insight. This is not just backward-looking, “academic” perspective; in this case, it gives us a trade setup.
- The strong selloff to B created strong downward momentum. You can see this on the chart, but we get additional confirmation from the MACD making a new low and price touching the Keltner Channel.
- The pullback from that level was “polite”: low volatility, and consistent upward drift.
Entry
Now, we’ve been stalking this entry for a while. On 1/9/19, I published the setup as a TradeLab for my MarketLife clients, and we’ve been reviewing the potential entry almost daily in our market update videos.
Patience is important, but one of the problems with trading is that you have to balance patience with the necessity of decisive action at the right time. I had to be content to watch this thing drift higher for almost two weeks, working entry orders every day, but with no trigger and no entry.
There are a few ways to enter, and personal preference comes into it. Some people might draw a trendline from the lows at B and enter on a break. Personally, I prefer simpler things and try to avoid lines that I feel I might just be making up. Entering somewhere under the low of “a few days ago” + “some noise” works pretty well for me.
Trade Management
Here’s where your trading plan should define exactly what you will and will not do. For me, this trade went +0.6R on the day of entry, and that justifies tightening the stop on the trade intrabar. In general, I try to avoid making decisions on the day of entry, but this is an exception—when there’s strong with-trade momentum and significant P&L, I’ll reduce risk intraday.
However—and I can’t stress this strongly enough—you must not and cannot make this up as you go along! If you do, you will easily fall into the standard emotional traps and find yourself making the same mistakes over and over again. Remember, price action is designed to generate an emotional reaction in the trader; without discipline, the market will cause us to make mistakes.
So, define this in your trading plan. Realize that it will not be perfect. (Just before this trade, I had a trade where I was stopped out on the 4 hour chart very near my entry price in the GBPUSD… which then continued smartly higher. This isn’t a mistake on my part; trade management will never be perfect!) Know what you will do in response to the market’s movements before you place that trade.
Spend a few moments with this chart: Simple pattern, and a solid example of the kind of trade you want to make, over and over.