[dc]I[/dc]t is certainly easy to find examples of real charts beside randomly generated charts–whether on websites and in books–and most traders know, by now, that it is very difficult to tell which charts are real and which are random. The conclusion that some people draw is that, since technical patterns appear on both real and randomly-generated charts, the entire idea of using price patterns to generate trading ideas is flawed–all forms of technical analysis are invalid. This conclusion is, itself, flawed on several fronts.
Real market prices show at least one very serious departure from simple random walks. A random walk has no memory of what has happened in the past, and future steps are completely independent of past steps. However, we observe something very different in the actual data—large price changes are much more likely to be followed by more large changes, and small changes are more likely to follow small changes. For practical purposes, what is probably happening is that markets respond to new information with large price movements, and these high-volatility environments tend to last for a while after the initial shock. This is referred to in the literature as the persistence of volatility shocks and gives rise to the phenomenon of volatility clustering. The charts below show the absolute value of the standard deviations of daily changes for several years of daily returns in a few different markets with only daily changes > |2.0 stdevs| shown. It might be a bit difficult to see from visual inspection, but these large spikes are not dispersed through the data set randomly—they tend to cluster in specific spots and time periods and tend to follow previous spikes.
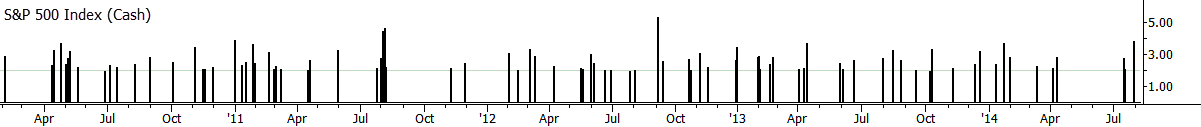
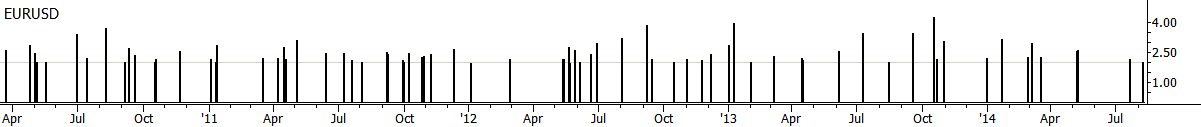

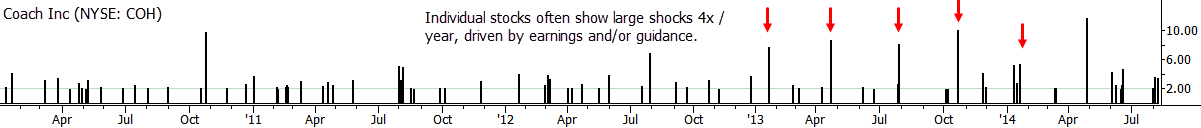
What we see here is autocorrelation of volatility. Even if price changes themselves were random and unpredictable, we can make some predictions about the magnitude (absolute value) of the next price change based on recent changes. Though this type of price action is a severe violation of random walk models (which, by definition, have no memory of previous steps), do not assume that it is an opportunity for easy profits. There is still a lot of random noise, and the market is also aware of this tendency for volatility clustering (even if individual investors sometimes are not); derivatives tend to be priced accordingly so, as always, there is no free lunch.
We’ve looked at practical implications of an autocorrelated volatility environment in this blog and in my book—for instance, in the tendency for large directional moves to follow other large price movements—but it is worth mentioning here that there are also academic models that capture this element of market behavior quite well. Autoregressive conditional heteroskedasticity (ARCH), generalized ARCH (GARCH), and exponential GARCH (EGARCH) are time series models that allow us to deal with the issue of varying levels of volatility across different time periods. A simple random walk model has no memory of the past, but ARCH-family models are aware of recent volatility conditions. ((Though not strictly correct, a good way to think of these models is that they model price paths that are a combination of a random walk with another component added in. This other component is a series of error components (also called residuals) that are themselves randomly generated, but with a process that sets the volatility of the residuals based on recent history. The assumption is that information comes to the market in a random fashion with unpredictable timing, and that these information shocks decay with time. The effect is not unlike throwing a large stone in a pond and watching the waves slowly decay in size.)) If this topic interests you, Campell, Lo, and MacKinlay (1996) and Tsay (2005) are standard references.
From a practical standpoint, volatility clustering is important for everyone to understand: certainly options traders must (the options market already understands and (largely) prices for this effect, so you should too!), but active traders, portfolio managers, and risk managers also need to be aware of this. When a market has a volatile shock, what is the best bet? That, in some way, shape or form, more volatility is around the corner, and do not assume a quick return to quiet markets. An important caveat is that this kind of volatility is non-directional. A market can make a big move up, and then have a period of volatility that is up, down, or sideways–do not draw the facile assumption that a large price shock up will lead to a further move up–maybe, or maybe not. The key point is that it is unusual for a market to become volatile and then to immediately go dead again. Volatility shocks tend to persist. Big moves give rise to more big moves. Volatility begets more volatility.

Very Informative; Thank You !
Hi Adam: Does volume play any role in your analysis? Do you look at increased volatility in conjunction with increased volume? Also, since the spot FX market does not have any volume, does the volume in the futures FX carry any significance?
Thank you,
Hi Nathan,
No, I don’t use volume in any meaningful role in my analysis, for one simple reason: I have never been able to quantify that it actually adds an edge. Every way I have sliced and diced it (with two minor exceptions), volume has been insignificant in all my analyses. Perhaps I’m missing something… I’m not saying that volume has no value, but I have never seen solid quantitative work showing that it actually does. Most of the work of TA that talks about volume is more on the order of market lore, and much of that is difficult to substantiate when you start digging into the numbers.
I agree with your opinions about volume. Perhaps at one time volume was more enlightening, but how can we even know the actual volume when much of the stock that changes hands occurs off the exchange? We know price must correlate with transactions on the shadow markets, otherwise there’d be arbitrage opportunities, but volume could be competely different, for example, showing a rising price on low volume on your charts because it’s actively being acquired by somebody off the exchange. I think market profile studies are about as helpful as it gets these days, showing you where the majority of volume is being transacted.
So much hidden volume… but even in older markets I can’t find an edge to volume. (Not that that matters, but it was an interesting academic exercise.) I don’t think the edge has ever been there, and I think, for all the talk about the importance of volume, no one ever actually verified it beyond looking at charts and saying that it looks important.