How to trade pullbacks
I'm starting a short series of posts here on pattern recognition, focusing on simple patterns that I have found useful in actual trading. Some of my readers may have questions as to whether it is possible to trade profitably based on simple patterns, given that so much modern quantitative trading focuses on volatility, spread relationships between two or more markets, and other types of trading that move us away from simple, directional trading. The answer to that is a qualified 'yes': patterns are heuristics, shortcuts, if you will. A trader who can read and analyze patterns can quickly drill down to the essential elements of market structure. Opportunity exists in markets when buying and selling pressure is not balanced, and patterns can help us understand this critical balance very quickly.
Though many of these patterns have a slight edge on their own (read this, for pullbacks), I think far better results come with experience and when the trader learns to read the action in the market; we shift from a "take every pullback" to a "find the best pullback" mindset. Traditional technical analysis often focuses on visual symmetry, how the pattern looks on a chart, to find the best trades, and I would suggest that this might not be right. The best patterns are often pretty ugly, but they fall in beautiful spots in the market structure.
How to trade pullbacks
The key to trading pullbacks is that you are trading the fluctuations in a trending market. For this to work, it's obvious that the market must be both trending and fluctuating. It is normal for trending markets to show pullbacks, but some very strong trends do not. Don't try to force trades in this environment--you don't have to be in any move or any trend; wait for the best trades. What might not be so obvious, at first, is that trading a pullback is a prediction that the market will continue to trend. I might suggest that this is slightly different from identifying a trending market.
From a simple perspective, trading pullbacks boil down to.
- Wait for a trending market to make a strong move.
- Look to enter the market when it comes back to some sort of "average" price.
Digging deeper
Both of these elements require a little more information, to be done well. First, you have to be able to read market structure and understand trends. It's not enough to say "this market starts at the lower left of the chart and ends at the upper right". That is enough to be able to identify high level trends, but, remember, you are looking for a market that will likely continue to trend. Being able to juggle elements like length of swing, lower timeframe momentum, exhaustion/strength will help, but, in my experience teaching and training traders, these are skills that develop naturally from trading pullbacks.
Identifying a market that has made a strong move can be done with the help of reasonably calibrated bands. There is a wide range of parameters and settings, but I'd suggest that whatever bands you use should contain roughly 80% - 90% of the price action. Consider Bollinger bands: if you set them 0.5 standard deviations, you are probably too close, and 5.0 standard deviations is probably too far. The first case will be hit constantly on trivial movements, while the last will only be hit with the most extreme exhaustion moves, but, in the middle, there is a wide range of values that can be useful. (I have found Keltner channels more useful than Bollingers, but I also think this is a matter of personal taste.) Play with moving average length and band width, settle on settings you will use, and don't change them. The bands provide structure that will be critical as you develop your intuitive sense of market structure.
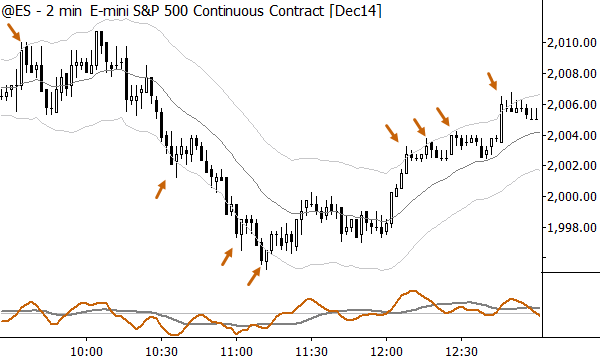
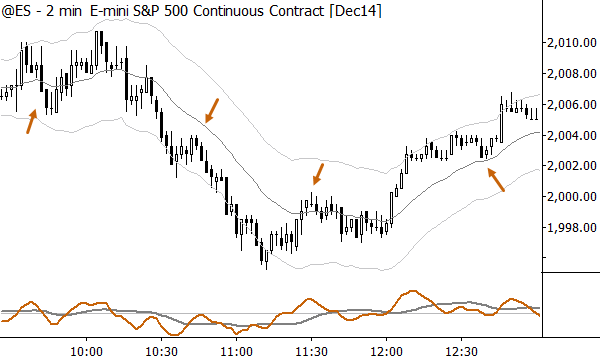
The chart above shows points where 2 minute (I focus a lot on higher timeframes, so let's look at intraday data a bit, too) bars touch the Keltner channels. Consider this as setting up a trigger condition, and then we look to enter somewhere "around a middle." Now, I've written at great length about how moving averages don't work (here, here, and especially here), so am I telling you to buy and sell at a moving average? No, the average price is not important, but the concept of trading near the average is what matters. If you test this, you will find an edge whether you buy in front of or through the average, and you will also find an edge with many different lengths of moving averages. There is no magic to the average, but perhaps there is magic in a disciplined, consistent approach to trade entry. Look at the following chart, which shows points where we might have executed (long or short) near the average following the setup condition in the first chart.
Further refinements for entries
Without going into too much detail, it is worth considering some other elements that are important. The most important is to remember that you are looking for a market that you believe will continue to trend, for at least one more trend leg, so it makes sense to avoid patterns that point to end of trends. The most important of these is exhaustion. Avoid buying and selling after potentially climactic moves, which can be identified on the chart as large range with trend bars that often extend far beyond the edge. I believe that identifying true with-trend strength (or weakness, for shorts) and being able to discern it from exhaustion is perhaps the key technical skill of with-trend trading. No one talks about it very much, and it can't be done perfectly, but, with some work and hard study, you can learn to dodge the most obvious bullets. (Note that this will also take you deeply into sentiment analysis and understanding crowd behavior.)
The actual entry trigger deserves a little bit of attention too. I've found a useful refinement is to use a lower timeframe breakout as an entry, and this can be as simple as buying a breakout of the previous bar's high. You can also trade around previous lower timeframe pivots (for instance, a failure test), and here is where some of the most powerful multiple timeframe confluences come into play. Other traders will scale into pullbacks, but this requires a level of discipline that can be challenging for newer traders. Because you're entering a market that, by definition, is moving against you, you will be "biggest when wrongest", and this can be a problem if stops are not respected. Now, about those stops...
Stop location
Mark Fisher used to constantly remind traders he worked with and trained that the most important thing is knowing where you're getting out if you're wrong. Know this, on every trade, and respect that point, and you're already far ahead of the game. The problem with pullbacks is that you are often entering a market that is not yet moving in the direction you want, so some degree of "slop" is required. We can be precise, but there are limits. Without belaboring the point, you will learn where to set stops, and they should go somewhere beyond the previous extreme. (I've covered this in considerable detail in one of the weeks of my free trading course.) As a starting point, 2-4 ATRs beyond the entry is a good, very rough guideline.
Trade management
If there is magic here, it happens in the trade management. I've found it helpful to take first profits when my profit is equal to my initial risk on the trade, and then to scale out of the remainder. This doesn't work for those traders who hope to hit homeruns, but it certainly does drive toward consistency. There are other ways, but the key is to define your trading style and manage accordingly. I'm a swing trader, usually playing for one clean swing in the market. As such, I need to be proactive about taking risk off the table, but different styles will require different techniques.
Last, it is sometimes possible to use pullbacks in trending markets to build substantial positions. One idea that might be useful is to get in a pullback, take partial profits and hold the rest for a swing, and then get into a second trade if another pullback sets up in the same direction. Manage that new trade in the same way; the key is that you are always taking partial profits and moving stops so that you never have on more than a single trade's risk. This is a smart and relatively safe way to "pyramid" into a trend move. Do remember that sometimes "stuff happens" and you may see a very large gap in a market, your stops may get slipped, and you may have a much larger than expected loss. Always respect risk, first and foremost.
Some examples
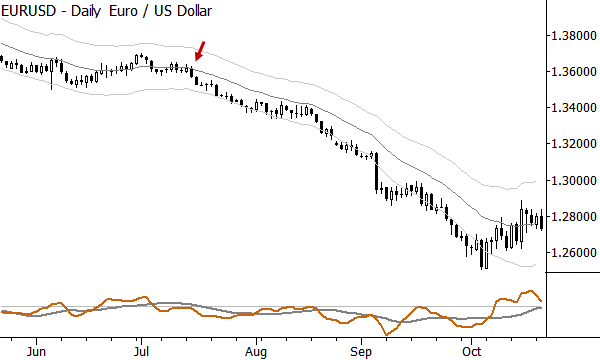
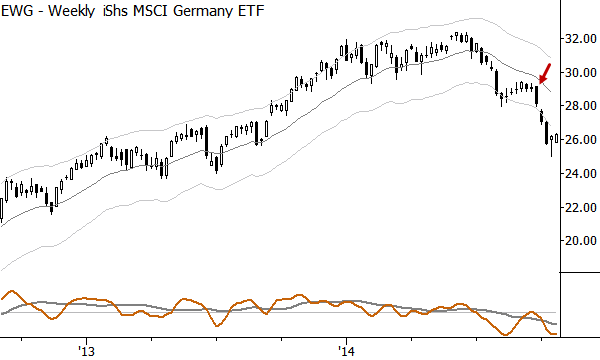
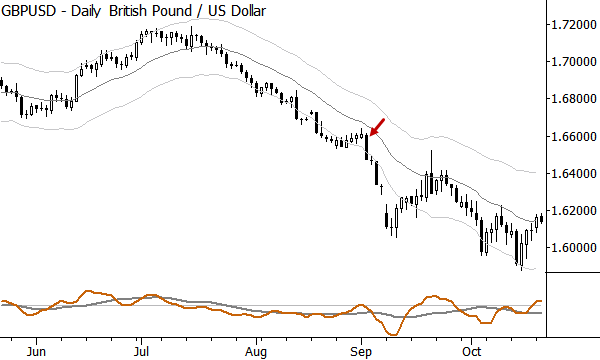
I thought I'd leave you with some examples. This idea of trading pullbacks is not just theoretical; it's one of the most useful techniques I have found in years of trading. The following trades are trades that were identified in real time (many days and weeks in advance of entries) and published in my daily research I write for Waverly Advisors. (Obligatory plug: we'd love to have you take a look at our work!) Most of these recent pullbacks have been winners, and some gave way to outstanding trend moves, but I also included a losing trade here as well. Only entries are marked on these charts, but consider these in context of the ideas and guidelines I've given here. This is, truly, one of the simplest and most powerful trading patterns, and is useful to traders working on timeframes from intraday to months/quarters. If you don't trade pullbacks, maybe you should?


