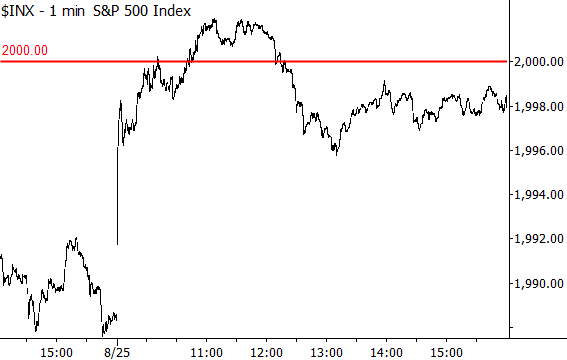
S&P 500 at 2,000. Now what?
[dc]S[/dc]ometimes, the obvious does need to be said. The S&P 500 cash index touched the big round number 2,000 yesterday. Here we are, in late summer, with very little happening in the world and few economic reports this week, so, of course, the media and blogosphere are filled with people discussing the number--there's nothing else to talk about. Many of the stories and quotes I read about this number today seemed to do a remarkable job of straddling the fence--saying that it is both important and not important, noteworthy and just a number. How should we think about it?

In general, the importance of "round numbers" is a hotly debated topic among traders. Some traders are absolutely certain that round numbers are significant, but it is hard, even under extreme torture and duress, to make the data reveal any significance at all. Personally, I have spent enough hours in front of enough screens watching diverse markets to tell you that the subjective trader inside me is pretty sure that round numbers do "sometimes mean something". I say that, even though the quantitative guy in me has done extensive research and is pretty sure that round numbers hold no statistical significance. In fact, what I really know is that even though I think there is significance here, I am almost certainly wrong--probably falling prey to cognitive biases and creating significance where none exists. (If you have not watched my video on this topic, please do. That was one moment in time, but it's interesting to watch what happened with those levels in the years after I made that video.)
What I can tell you is this: The S&P 500 index is one index out of many. Why is 2,000 on one index important? The Russell 2000 is nowhere near its recent "round number" of 1200 that it touched back in July. The Nasdaq Composite knifed through 4.500 a few days ago, and the DJIA is "playing around" with 17,000. DAX futures "found support" at 9,000 a few weeks ago, and I could go on. One other problem to consider is that there are several "incarnations" of the S&P 500. Are we accounting for dividends? Using the SPY? The futures?
Pick a number, any number, and we will focus on it and anchor our thought process there. This is part of the seduction of many subjective methods--even though there's no statistical significance, our minds are easily convinced otherwise. This is why I think you need to be two traders: yes, be the intuitive, sensitive, synthesizer--the artists who revels in patterns and permutations. But also, be the hard-nosed scientist who provides discipline and structure, and keeps those flights of fancy on a short leash. Art and science, you know?
As for what happens next, stock indexes typically pull back for about a month after making new highs. (That's not a casual statement; there are hard stats behind that.) There could also be some soft seasonal influences over the next few months, and the fact we made new highs on mind-numbingly low volume might actually have some significance, but the current extended "downtrend" in equity trading volume is unprecedented in the historical record. (In my work, I have been unable to verify an edge for volume in most applications, but this is one place there does seem to be an edge.) Longer term market structure is strong, and every sign points to an intact uptrend. As I said in an interview last week, everyone is talking about the historic bull market. I suspect history may say that 2014 stood at the late beginning of the historic bull market.


