The first time you hear someone tell you to ignore something happening in the market, it might be surprising. Ignore it? I thought we were supposed to be trying to figure everything out! Why would we consciously ignore something? If we’re trying to be responsible, educated traders, why would we not pay attention to everything?!
I’ve spent a lot of time this week talking with traders who are trying to figure the stock market out. I’ve also participated in some group discussions in which people have been very passionate about market direction… but also very confused.
That’s normal, because this is a very confusing time in the market. In fact, it’s a time when we probably want to ignore much of what we see.
The reason is that much of what we see is random noise, and sometimes it’s nearly entirely random noise. Right now, the short term movements of the stock market are almost entirely random noise.
In the case of the chart of the S&P 500 below, I think there are at least three things that tell us we should not be trying to figure out the tiny swings here:
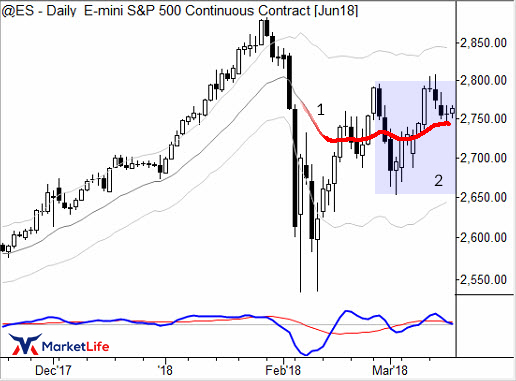
1. The market is chopping back and forth around the moving average. When we see any market cling to any intermediate-term moving average, that’s probably an indication that the forces of buying and selling pressure are pretty much in balance, that the market is in equilibrium. Here’s a snippet from my first book that relates to this condition:
… at those times markets are efficient in the academic sense—random walks prevail. There is no consistent edge possible in such an environment; it is not an exaggeration to say that the essence of technical analysis is to identify markets that have a temporary imbalance of buying and selling pressure, and to limit our trading to those environments. One way to identify markets in equilibrium is that they tend to stay close to an average price (moving average), which represents a rough area of consensus. If the market continues to trade around that average, chopping back and forth on both sides of it, it is probably best to move on and to look for better trading opportunities. This might seem like common sense, but a rule like this can keep traders from making multiple attempts at trading a flat market. (The Art and Science of Technical Analysis, p. 192)
2. The market has retreated into the range inside the previous swing, highlighted by the shaded box marked 2) on the chart.
3. General volatility compression (smaller ranges, shortened swings, and flattened MACD) is also apparent on the chart.
At the beginning of the week, it was fairly easy to see the market might retreat back into that range, and, if it did so, we would need to ignore most of the day to day fluctuations. Rather than get caught up in the emotions of trying to predict, acknowledge the market is in a particularly unpredictable (in the short term) phase. Ignore the random noise, and wait for the emergence of true momentum.
It’s worth mapping out some possible ways the market might leave this range, and to consider how we might react in those cases. In fact, that’s the essence of the swing trading challenge in this difficult market environment.
Doing this is hard for many traders. It takes trust in your methodology, but working to separate the significant from the insignificant can give you deep insight into the market’s movements and most likely future outcomes.