A shift in perspective
Sometimes we can take tools we know and look at them in new ways. Doing this can give a surprising new perspective on how markets move, and can often suggest new places to look for edges.
Here’s an example. I use Keltner Channels on all my charts, and have for nearly 20 years. (You can do the same thing with Bollinger Bands or any similar tool.) There are many ways to use bands, but one common use is to assume that a market touching a band might mean both that the market is showing momentum and maybe that it’s overextended and due for mean reversion.
To do this, most bands are created so that the bulk of the market data is within the bands.
What happens when we focus on the unusual? Take a look at the chart below, which shows only the times the S&P futures went outside of the channels (using day session-only futures data.)
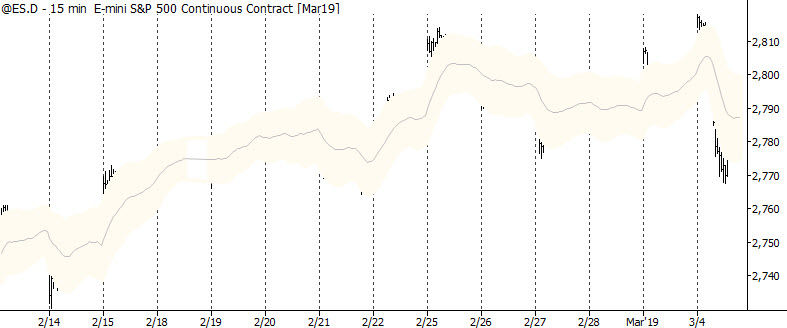
I'll leave you to draw your own ideas from this, but here are a few points to get you started:
- As expected, seeing the market come outside the bands is a little unusual.
- What happens after the market goes outside the band? Would it be different itwe loooked at more data?
- Does the slope of the moving average (i.e., the overall trend of the market) matter?
- How might this tool be different on daily charts (as opposed to intraday)?
Think about that other tools you are using that you might be able to tweak and twist in a different way. (For instance, I wonder if the MACD evolved out of a similar process!)
Sometimes, using simple tools in novel ways can show us entirely new ways to see the market.


