One step ahead...
The most important factor setting up pullback trades, and a simple framework for market and trend analysis that really works.
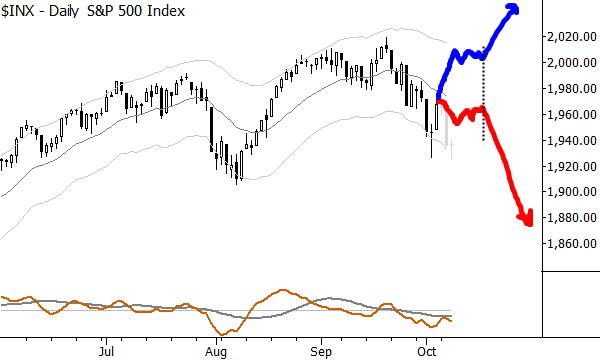
Swing trading is a style of trading that tries to extract the most value from a single swing in the market. In general, swing traders are not comfortable with too much "give back" and usually work reasonably tight stops on positions, though, of course, there are exceptions. Swing trading is not a timeframe; you can swing trade on 5 minute bars or swing trade on monthly bars, but the key concept is that we want to find high probability swings, reasonable entry points, and then work to actively manage the risk in those trades. One of the keys to understanding this trading style is understanding the importance of the next swing, and how it can set up a potential trade. Take a look at the chart of the S&P 500 cash index:

I have greyed out the last few days on this chart, so I can better show the thought process. The S&P had been declining into early October, and there was a lot about this decline that was somehow different than previous declines. The current selloff ended with a mini-selling climax that went through the lower channel, and then the market bounced. At this point, I wrote something like "the next bounce will tell us a lot about the character of this market, and could even set direction into the end of the year" in my research. Why? What does that mean, exactly?
Well, the thinking is that we don't know a lot about the market. In fact, I think we know a lot less than we think we do. I have a ton of quantitative work that suggests that support and resistance are mostly coincidence, moving averages are meaningless, retracement rations don't really work, most statistics have limited predictive value--I could go on and on about what doesn't work, but the point is we know very little about the market. One thing we know for certain, though, is that no market move will go on forever. If the market is going up or down, that will eventually stop. Furthermore, the market's reaction to a strong move (strong move suggesting non-random conviction behind the move) can be very important.
So, the idea is the market was bouncing off a low. I don't care about this bounce for a trade and I'm certainly not looking to be long on this bounce. However, the character of this bounce will tell me if I should be looking to short for another downswing, or buy for an upswing. If the market rallies strongly off the lows, I know that rally will eventually stop (consolidate), but there is likely an edge to buy for another swing up. If, however, the market goes dull and flat, or even turns back down, then the edge will favor shorts for the next swing. I roughly outlined both of those options with the hand drawn red and blue lines, but be aware that these are only very rough ideas--the actual action can include a lot of noise, headfakes, and confusion, but the main idea is still the importance of the strength of this bounce: how far it will extend, how quickly, and how the next pause might set up another trade.
There is certainly room for subtlety and nuance, and experience does play a role. Classical technical analysis has cataloged hundreds of variations of these reactions, but I don't think you need them. What you need is to work toward an intuitive understanding of the character of that next reaction, and I think this basic framework can be useful to all traders working in all timeframes.
Sometimes, things are so simple we miss the important things. Loud voices offer sophisticated-sounding explanations and dire predictions following every move, but the trader's mindset is to step back and say "ok, we don't really know much, but what do we know? What can we do with what we know? Is there something non-random going on here, and can I structure it, manage the risk, to set up a trade?" Look for a sharp move, and then watch the reaction to that move for clues to future market direction. It's not exciting. Maybe it's not the sexiest analytical concept, but it works.
[If you want to dig deeper, this is obviously a simplified perspective--a distillation of the most important thing you need to know--on trading pullbacks. Much more depth is available in this video, which is part of my free trading course (which you might also want to check out!)]


