Beyond Patterns: Rethinking Candlesticks
In the inaugural Hudson Sessions, I shared a cool new visualization. Some of the viewers found it challenging, and a few even dismissed it as being impossible. I understand! Even with decades of daily trading under my belt, this unique perspective on market data has unveiled significant revelations.
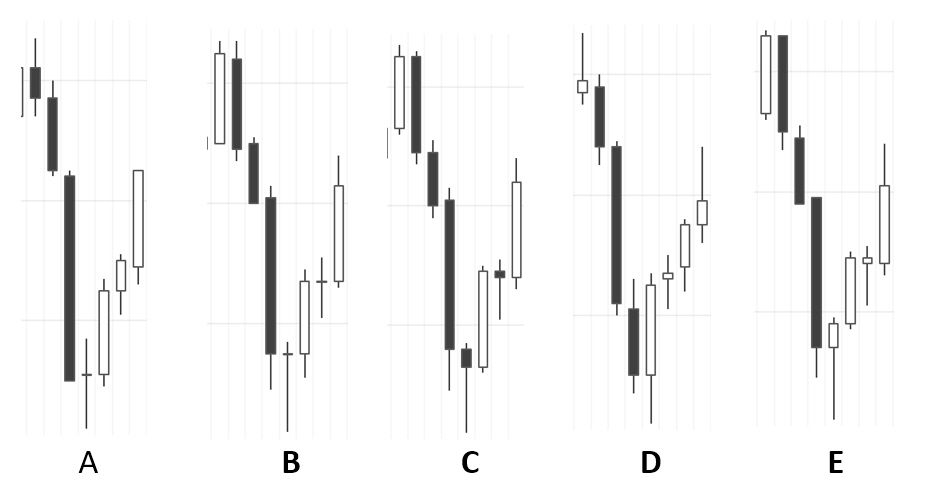
Before we get into the details, take a few moments and look at—really look at—the price bars in the chart at the beginning of this post. Focus on the reversal at the bottom of the swing and ask yourself a few questions:
- Are these patterns different or the same?
- Do they suggest different things about strength or weakness?
- Would you have made different trading decisions based on these patterns?
Two schools of thought
There are, broadly speaking, two opposing schools of thoughts about price patterns. On one side, you have people who claim that every slight detail of every bar is meaningful. On the extreme fringe of this are the people who claim that markets are, always, 100% predictible. (Sidebar: that seems to me to be an absurd and absolutely indefinsible position. Anyone making such a claim is either playing word games, trying to be sensationalistic, or simply ignorant.)
But even without going that far, there are schools of traders who assign great significance to tiny details of price charts and (usually) candlestick formations. These people often slip into thinking that the majority of traders are using the same tools and seeing the market in the same way they are, even down to specific timeframes and indicators.
The other school reminds us that markets include a high degree of noise and even randomness. Yes, there might well be intent behind the price movements, at least sometimes. And, yes, maybe sometimes patterns are meaningful. But much of what we see is misleading, at best. A lot of the market’s behavior merely tempts us to find patterns in randomness. If this holds true, obsessing over pattern details could prove to be a misstep.
Offsetting price bars
The chart at the top of this post shows several views of identical price action. To build these views, I started with tick data and then constructed time bars from that data. I then “offset” the beginning of each bar by a certain amount of time.
The area under consideration is the afternoon turn from 5/11/23 in the S&P 500 futures, presented in 3 minute bars. Each variation offsets the start of the bar by anywhere from a few seconds to a few minutes.
The map is not the territory
Take a step back for a moment, and consider the market in its raw form. At this level, the market is simply data and transactions. There is a bid/ask spread, and other orders beyond those, and sometimes trades occur at various prices.
To make sense of this, we segment it into bars or candles—terms I'll be using interchangeably. This is critically important: the market exists, doing its thing, and we use the bars on our screen to get a perspective on the market. To say it another way, candlesticks and patterns are a representation of the market.
If the patterns above would have led you to drastically different decisions, you’re anchoring your trading decisions to something that might not be based in reality. These are, obviously, representations of precisely the same price dynamics and underlying market conditions. These patterns also all had precisely the same outcome.
Ask yourself: if these are all really the same thing, am I making a mistake in focusing too much on the details?
Is it all in vain?
The natural reaction to this might be to throw in the towel, declare that nothing holds any meaning, and decide to quit trading altogether. But I think there are more powerful insights to be had here, so let me share my personal perspectives.
First, this is not a radical surprise to me. Though this visualization is new, my work with tick bars, time series analysis (quantitative work, not chart trading), and deep contemplation about the market made me aware of the underlying issues. This is why I’ve always been deeply suspicious of the people who tell us that every tiny detail is brimming with signicance, and why I’m firmly in the camp of respecting the randomness of financial markets.
Second, I think this calls us to a way of looking at price bars which does not focus on specific patterns, but, rather, on understanding what those price bars tell us about the conviction behind the moves. Concretely, you might think about “reversal complexes” (a term I think I coined) instead of just pin bars. You might start thinking about how a price bar strides a timespan, and how a shift might show you the same thing in different ways.
With this mindset, the first chart in this post could prove valuable. These are all equivalent patterns. Perhaps they should find a place in your trading plan.
The unchanging
It’s also useful to think about what does not change, when we shift perspectives. Consider the following graphic, which shows a cleanly uptrending section of the market. Though there are variation (don't let these mislead you), all of them paint essentially the same picture.
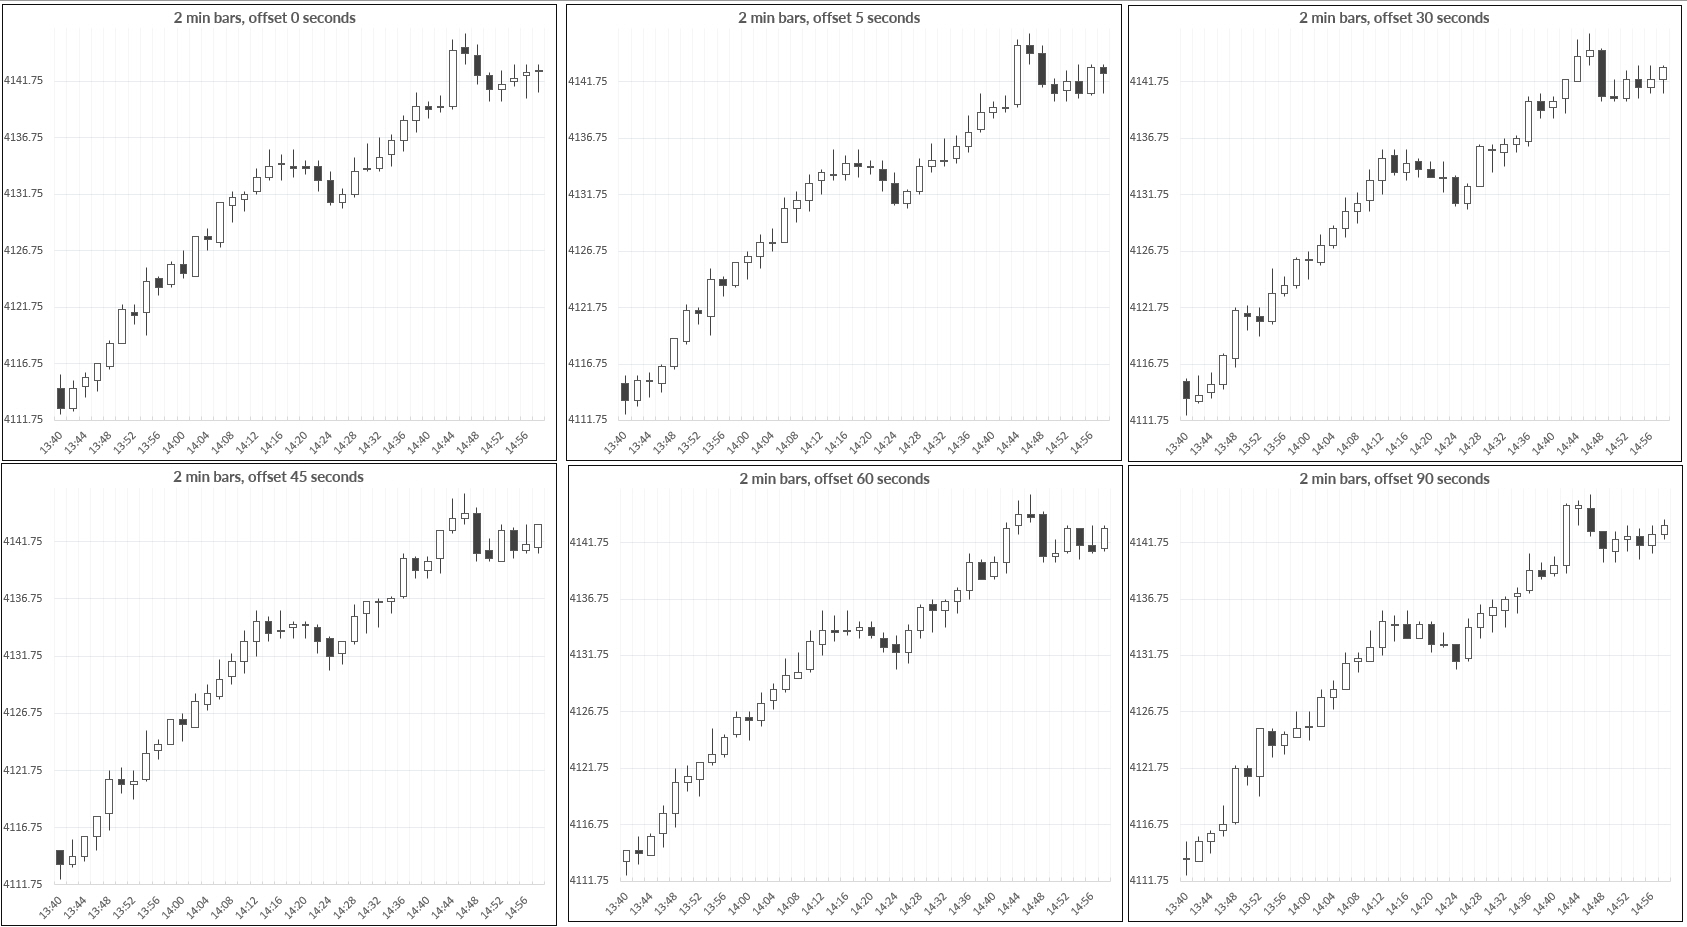
Consider the trend legs: there are no real signs of weakness. Look at the first pullback in the middle of the chart. Though there are variations here, we still see some patterns suggesting loss of momentum (smaller ranges, and dojis) at the turns, followed by no significant selling pressure.
To my eye, there is a climax on some of the panels going into 14:45 or so, but not on others. This climax turned out to be meaningful, and we might have missed it, through no fault of our own. However, it was followed by a strong selling bar that is visible in almost all panels. (Note that the last one breaks this bar up into two, not-so-convincing, bars with tails at the extremes.)
I've distilled these lessons into a perspective on price bars and candles that emphasizes elements likely to persist across time slices. I’m finding this very useful in my own trading because it aligns my chartreading more closely to the underlying truth of the market’s action. And seeing truth, even if it is hard to accept, is always a good thing!
I may delve deeper into this work in the future, and I hope you'll join me for the next of the Hudson Sessions. Your presence and participation would be greatly appreciated.


