Just a quick post to remind you of a technical tool you probably already know about. Like so many things that work, it’s not exciting or sexy on the surface. It might seem overly simplistic or just not that interesting–but this is a powerful pattern that demands attention.
NR7 means that today’s session is the narrowest range of the past seven sessions. This was a condition that Toby Crabel wrote about in Day Trading with Short Term Price Patterns and Opening Range Breakout. This is a now-famous out of print book, and I can remember when no copies were available for under $1,000 a few years ago–a great book focusing on real stats and what actually works in the market. Take a look at the chart below:
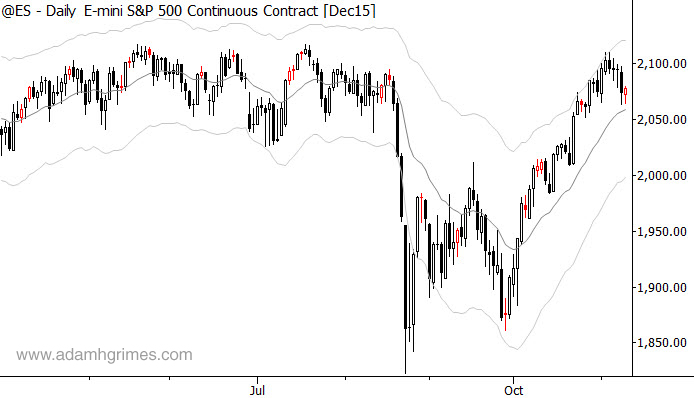
This condition sets the market up for a trend day; there is a higher probability of the following day 1) having a larger than normal range and 2) having more directional intraday action. Used alone, this pattern can tell intraday traders when they should be focusing on potential trend days the following day. Used on conjunction with other conditions and patterns, it becomes even more powerful.
Take a few moments to inspect the chart above and to note what types of days typically follow NR7 days. Think about how you might incorporate this information in your own trading plan–there is valuable information here for trade entry, risk management, and for many other aspects of the trading process, as well. This is a powerful tool that probably should be in your toolkit as a technical or tactical trader.
Great insight Adam! Thank you, couple of questions: 1. Does a similar NR7 concept apply to the other futures markets? 2. On the ES, do you consider NR7 on the 24 hour chart or only the day session chart? Thank you,
Nathan,
NR7 as well as 2NRID et cetera apply to all markets and all timeframes…..even if you trade the ES my preference would be to look at NR7 on the day session of the SPY only, but otherwise I would run on day “pit session” range only of the ES. The problem with running a 24 hour basis is that you are giving weight and credence to activity that will occur on very low volume and thus is not reliable (because is not representative of any true broad based supply and demand). Regards, Christian
Thank you 88!
Should I enter here right now? Should I set the stop-loss there? The “5 Trading Patterns”, ATR channels, Sigma Spike, NR7, pivot point, Trend change or continue, S/R hold or fail … “It depends.” It depends on ones instinct, insight, experience to incorporate all these information to come out trading actions – Buy or Sell. There is no right or wrong for 2 people given the same above information and came out with different actions. Since nobody knows for sure what will really happen next. All we can do is keep watching and respond appropriately.
I may not buy Crabel’s book and I think that 4 and 7 are somewhat arbitrary choices, but as an ATR fan I like this very simple way of looking at volatility over time. It’s somehow cleaner to me than Bollinger Bands and may just be simple enough to make it into my very small toolbox. Thanks for bringing it to our attention!
I guess Narrow ATR(1) and Narrow Range will have above 95% similarity.