Looking at multiple timeframes of the same market (“multiple timeframe analysis”) is a common practice. There are many nuances to this approach, and many ways to use the information on different timeframes. But what do we do when the timeframes are in conflict? What do we do when one timeframe says up and the other says down? How do we resolve this issue?
I’ve written on this topic before, but it’s always interesting to see old lessons in new market patterns–if we are focusing on true fundamentals of how price patterns develop and how price moves, we’ll see pretty amazing continuity from year to year. So, let’s revisit this old idea with an example from this week’s (early January 2022) currency markets.
First, it’s important to clarify what you expect from each timeframe. To be clear: there are a number of possible answers, but my personal inventory looks something like this:
- I tend to focus on a trading timeframe and to consider only a higher timeframe (not a lower). (I often infer the HTF (higher timeframe) information from a single chart, but that’s another discussion.)
- On my trading timeframe, I’m looking for a handful of tradable patterns I use over and over.
- On the higher timeframe, I’m primarily assessing trend integrity and looking for the possibility of extremely obvious levels that everyone else might see.
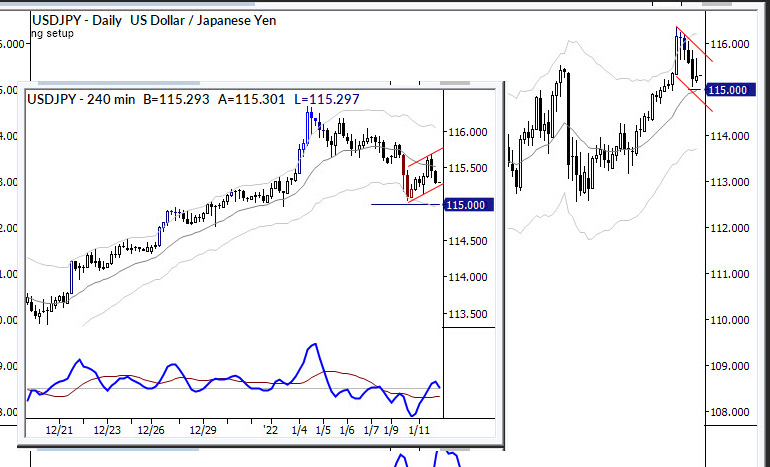
This is usually easy, but sometimes a situation arises where the timeframes are almost precisely in conflict. Look at the chart in this post.
An example from the USDJPY
In this case, we have a bull flag on the daily timeframe, and a bear flag on the smaller, inset 4 hour timeframe chart. (The horizontal line at 115.000 is a proposed stop level and isn’t particularly relevant right now.) So, the daily chart has a bullish pattern, while the 4 hour appears set to sell off.
Many traders might approach this with the idea that the higher timeframe is more important, and always give preference there. This is probably a mistake—the way I think of it is that “control” passes from one timeframe to another; there certainly will be times the higher timeframe dictates outcomes, but many times the lower timeframe may decide everything.
The answer, in this case, is relatively simple: you’re going to take whichever pattern triggers first, and you’re going to pay attention to the lower timeframe first. This is usually the case because the lower timeframe pattern will likely trigger sooner and with a smaller price movement.
Furthermore, good trading concepts are automatically embedded in this procedure. My bias was ultimately wrong—I was looking for more upside based on the daily bull flag, but I’m aware of three classic ways in which flags can fail. One of these is by the emergence of clear downside momentum against the pattern—in the case of a bull flag, the market breaks down with strong selling pressure.
If that happens, isn’t it likely to be driven by the bear flag on the 4 hour chart! This is the beauty of this approach: a successful short trade on the 4 hour will almost certainly invalidate the bullish pattern on the daily. If we are looking for a long entry on the daily (and are eventually proven wrong), then the successful entry of the bear flag will, at the very least, keep us out of trouble.
Other solutions
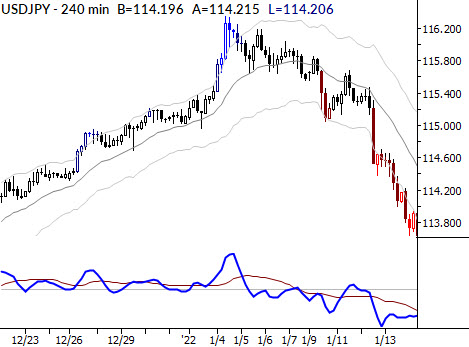
This certainly isn’t the only possible approach. Many traders simply avoid points where timeframes are in conflict, and this is not a bad solution. In fact, the example I’ve shown in this blog post (see chart below for the outcome of the trade) is a bit unusual because the lower timeframe trade won with gusto. It’s probably more likely to see timeframes battle it out and result in more crosscurrents (and more opportunities for stops to be hit!)
It’s also possible to develop plans for utilizing multiple timeframe information in other ways, including different indicators and triggers on different timeframes, but I think the key to making all of this work is to first understand what each timeframe is expected to do alone, and then to think about how they might interact when they reinforce each other and when they conflict. Thinking about these factors before you encounter them in the market generally leads to better trade outcomes and more successful trades.