Levels are everywhere in trading. There are thousands of ways to find, define, use, and misuse levels. Many levels simply don’t have an edge.
In this blog post, I want to share some work we’ve done recently for our MarketLife members, and I’ll give you some concrete ideas about how to use levels in your trading in an upcoming post.
My work with levels
I had a set of levels I developed and used in my intraday trading in the early 2000’s that were based on volatility, relationships of previous bars, and included a perspective on longer-term trend. When I started doing hard-core statistical work, I discovered that it was very difficult, if not impossible, to verify that most levels had an edge over random expectation. (Though this research shows some promise!)
I also became more aware of cognitive bias, and saw that any level drawn on any chart at any time would appear significant to a trader. Keep in mind that this was almost 20 years ago, but the situation hasn’t changed: most of the people who talk about levels do so after the fact, saying things like “oh look once again this market stopped at a Fibonacci level. Isn’t math amazing?” But, of course, there’s no rigor in that thinking and nothing is ever really critically examined.
I found that I could trade very well without the levels, so I gradually eliminated all but the most obvious levels from my trading process with no negative impact to my results. Momentum and market structure were far more important. However, I always wondered if maybe I wasn’t missing something… perhaps I had thrown the baby out with the bath water?
In recent years, I’ve done more work and developed some new methodologies for evaluating levels. (This blog post was an interesting part in that process, using human discretion as an input to a statistical evaluation.) When I revisited my old levels, I found they worked very well… perhaps astonishingly well. It’s no exaggeration to say that most levels are statistical garbage, but these have an actual edge.
Meet the PowerLevels
The problem with these levels is that there was a wide range of them that could be in play on any day—as many as 20+ and these clustered within about +/- 3 ATR of the previous bar. In practice, I never used all of these, but had a complex mix of discretion and rules to tell me which levels were likely to be in play on any day.
In recent weeks (as of October 2020), and having some free time thanks to ongoing coronavirus resitrictions(!), I took a shot at fully automating the level selection process. I won’t go through all the details (nor will we reveal the inner workings of the levels in detail), but the general idea I was working with was that the algos had to mirror my thought process as well as possible.
We’re still tweaking a bit, but are mostly there. We’ve been using these levels internally for several weeks, and are very pleased with what they’ve brough to our trading. We’ve used them to set stops, refine targets, and derive overall directional bias for the day.
Two Sets of Levels
There are two sets of levels we are using at this point: Each day, we generate intraday levels based on the previous day’s closed bar. We publish these levels as part of our PreMarket Edge report. (Which, by the way, is pretty close to the best value in the business. For $19 a month (less than $1 a trading day) you get these levels, a quick premarket video with my insights and gameplan for the coming session, a carefully crafted list of premarket movers you should pay attention to, and much more.)
The second set of levels are more important for daily structure. These levels are generated before the week begins, and are valid for the entire week.
A quick test
You should ask if these levels are better than random levels would be. (That’s always the question to ask of any technical tool.) The answer is a resounding yes. Here’s one illustration: Take a look at the intraday levels (displayed as dots) on the chart above. Remember, these are generated at the close of the previous bar, and so are fully known before the day begins.
A casual look at the chart above shows that there seem to be many bars where “almost” the exact high or low of the bar was “a level”. At first glance, this looks pretty cool, but wait—we’ve drawn many levels on the chart. Maybe—in fact probably—it’s just our pattern recognition machinery misfiring and it looks better than it is. That should be your default thinking.
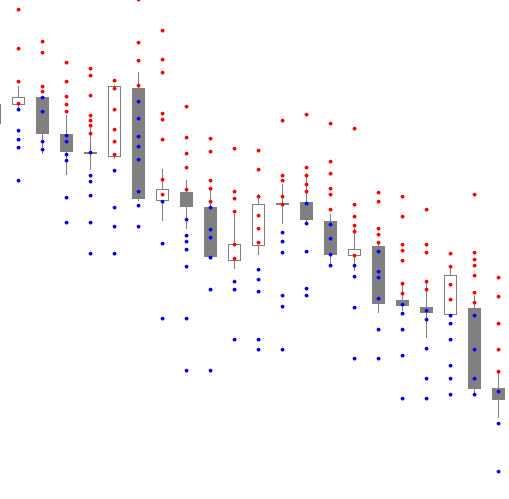
One way to test is to compare the real PowerLevels to randomly-generated levels. Doing this requires a bit of thinking, but we settled on letting the PowerLevels define the range for the day and then scattering randomly distributed levels throughout that range. (One of the subtle, but very powerful aspects of the real levels is that they respond very quickly to shifts in volatility. You can see on the chart above that sometimes the levels are very wide and sometimes might tighter.) If we run the test without this condition, simply scattering random levels over a range, the real levels crush the random levels. Giving the random levels this bit of information at least makes it a fair game.
But the random levels still lose, showing that the PowerLevels really do define the high and low of the next day more often than would be expected. Looking at a representative sample of active markets, we find that the closest PowerLevel is within an average of +/- 0.23% of the final high/low for that session. Looking at random levels, that distance is almost three times as much, at +/- 0.63%.
This is just one illustration, but, given the other work we’ve done and how long these levels have been part of my toolkit, they are strongly suggestive of an edge.
Of course, there’s more to using a level than just knowing where it is. And that’s what we’ll cover in the next blog post! Stay tuned…