This is a follow-up to this post in which I laid out the conceptual background that supports my trading. In today’s post, I’ll get into specific ideas and structures I look for when trading.
Charts
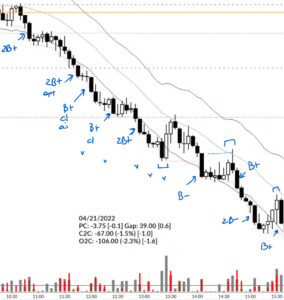
Charts are my primary tool for trading. I use both candlestick charts and bar charts. The main advantage of candlestick charts is that they tell a story at a glance. The main disadvantage is that it’s easy to read too much into that story.
While I want to keep this post practical, there is a theoretical piece that is absolutely critical to the way I see the market. A chart can be thought of as a random sample of a stream of price data. Random samples are a good way to look at data—the sampling effect of charts does tell us something useful about the market. For instance, it is true that most candles in a strong uptrend will be “bull candles” (i.e., the close is higher than the open).
However, it is a serious misconception to think that every nuance of a chart has meaning. There are many price action traders who teach that every tiny detail matters, and that one would make a very different trading decision if a candle were different by a single tick. This is a crushing misconception, and one that should be easily corrected when we notice that charts are different with different data feeds.
Without going into too much detail on this subject here, let me say that charts are good for getting a sense of the overall “mood” of a market. Charts can also define precise entry and exit points. But charts are noisy. Some of what you see on a chart is essentially random noise, so be careful of attaching too much significance to details on a chart. If you want to think about this more, check out this Hudson Session and these posts.
Moving averages and bands
While not strictly an indicator, I do find an intermediate-term moving average to be essential to the way I read charts. Without that “center,” my intuitive reading of price movement is much less valid. There are many pieces of information we can take from a moving average:
- The slope of that moving average
- Turning points of the moving average
- Price touching or crossing the moving average
- Price remaining on one side of the moving average
- The distance price moves from the moving average
Most of these are not statistically significant. (For instance, if you’re making trades based on when price touches a moving average, you must know that you are doing something that is utterly without statistical support.) The most useful information, to me, is how far price gets away from a moving average, and the best way to show that is with some kind of bands.
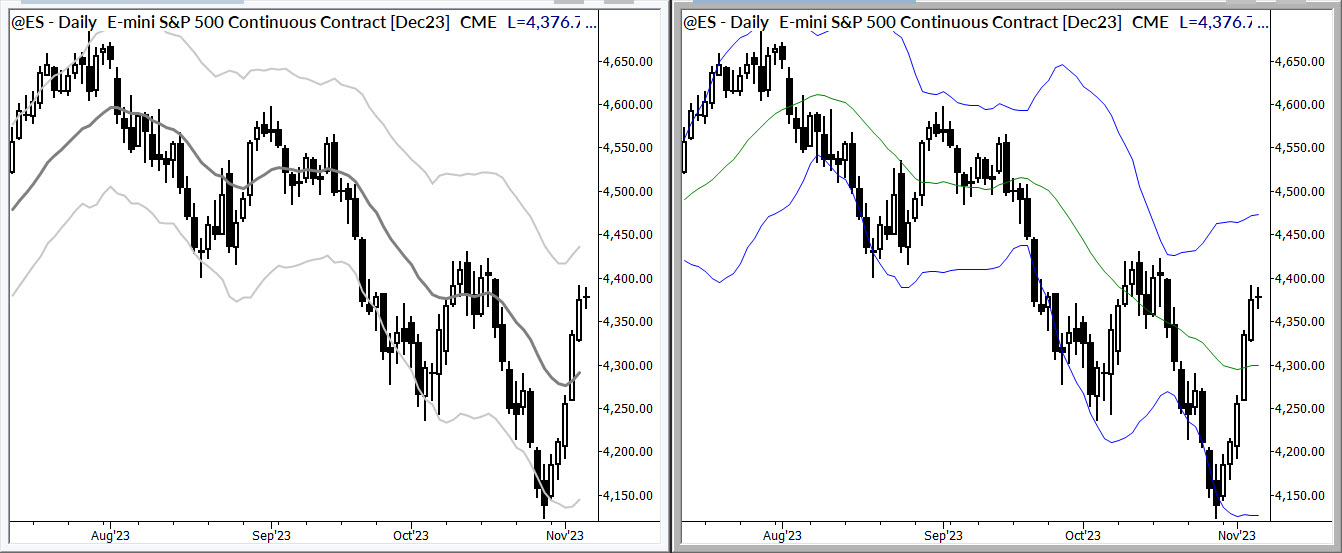
There are thousands of indicators out there, but there are basically two approaches to bands that make sense. Keltner channels are my choice; they plot bands based on ATR (range of each bar) from a moving average. Bollinger bands are more commonly used, but there are some fairly serious mathematical issues: their reliance on standard deviation makes assumptions about distributions that are clearly false, and they are centered around a nonsensical measure (standard deviation of price, rather than returns). The chart below compares Keltners on the left with Bollinger bands on the right.
Other indicators
There are no magic indicators. Indicators can be helpful when they pull out certain aspects of price movement that are interesting to the trader. Indicators can also be a useful crutch for developing traders. Over the course of my trading career, I have used indicators covering the complete range from very simple to complex (sometimes using hundreds of lines of code), and have found no advantage to complexity. It’s important to understand what you expect from these tools, and to define how you will use them.
There are no leading indicators. (This misconception comes from a misunderstanding of a term applied to some macroeconomic measures.) Indicators simply process and repackage OHLC data, sometimes with the addition of volume or other data. Indicators are calculations which can highlight important aspects of price action.
Much confusion centers around these tools. Some traders say indicators are useless and others rely on many indicators. My work suggests that there is little, if any, statistical edge in most indicators. I certainly don’t think there’s value in magical, proprietary indicators. I know that many gurus sell indicator packages for thousands of dollars, but I’ve never seen any that justify the cost.
The way to think about indicators is to consider what you want them to show you. This is a fairly radical approach to these tools, but it shouldn’t be! The usual approach is to choose an indicator (how? randomly?), put it on your chart, and try to understand what it’s showing you. I most strongly suggest you try it the other way—think about what you want to see and then find an indicator that does that.
The low hanging fruit here would be indicators that highlight big moves, over multiple bars or perhaps single bars, as a measure of momentum. Another easy application would be an indicator that shows some kind of overextension. Much work is needed to make sure these are useful.
Be careful of using indicators that overlap each other too closely. Having multiple correlated inputs does not add any power to your analysis. Rather, it increases your confidence in your read of the market without any justification. (Those of you with a quant background recognize my repackaging of the problem of multicollinearity here.)
I tend to only use indicators to highlight points for illustration. I don’t find them particularly useful for my own trading.
Patterns
All trading is really trading of patterns. This is even true of traders who claim to not use patterns! Of course you are using patterns—your patterns may be complex; they may include fundamental or other data. Anytime we place a trade, we are assuming that something is more likely to happen in the future than something else—that we can say “something” about the probable path of future prices or volatility. (Contrary to the claims of some people who sell trading material and do not trade, all trading is “predictive.”)
Of course, it’s important to realize that your “predictions” play out in a slight shift in probabilities, at best, so they are only visible in meaningful sample sizes. On any one trade, any outcome is possible; over a large sample we should be converging on a larger likelihood of profitability.
Putting this to work
So what does this mean in practice? First, I only look to take trades when the market is somehow imbalanced. This occurs in two main ways:
- When the market has made a large directional move without snapback (mean reversion). This indicates that one group (buyers or sellers) has dominated.
- When the market has reached a point of potential overextension and has gone too far. This suggests that the dominant group has run out of ammunition and that a turning point could be near.
These two trades are pretty much diametrically opposed. Think about it: in both cases, you’ve just seen the market make a big move. (Now you see the value of indicators to help highlight those big moves.) In the first case, you’re betting that the move will lead to another move in the same direction. In the second, you’re expecting the next move to be back, against the big move.
Obviously, you can’t make both of these trades. They would cancel each other out! So, how do you know which one to make? First, it’s a question of degrees. If the strength is new, it’s more likely to continue. (When I say “strength,” this could also apply to selling pressure. If you’re a stock trader, you’re more likely to think asymmetrically and to be biased to the upside.) If the move is too weak, it’s likely to lead to mean reversion. If the move is extreme, it’s also more likely to lead to a snapback. There’s certainly a Goldilocks zone where good trades set up.
This is why you must have some assessment of how the market usually moves—there’s no other way to know what is extreme.
Also, if the market has made many moves in the same direction (i.e., trend legs), then reversal becomes more likely. There are also overlaps here with potential overextension on higher timeframes, but it’s not necessary to add those layers of complexity.
With-trend trades
Most of my trades are with-trend trades, meaning that I am looking for the market to make a move and then make another move in the same direction. For these trades, which are the bread and butter of my approach, a rough plan looks like this:
- Find a market which has made a large move. One way to identify this is to look for a market which touches a channel (upper channel for a long trade, and vice versa for a short).
- Assess the character of the first pause. If it “gives back” too much of the move, then no trade. But if it holds together in a solid consolidation…
- … then look to enter in the direction of the previous move. There are several possible entries, which I have explored in considerable detail in The Hudson Sessions.
Countertrend trades
These are more complex, but they tend to take place around points of extension which line up with visible levels in the market. In my opinion (and experience), there’s far too much facile thinking about “supply and demand” zones right now—it’s one of the current fads perpetuated by fake trading gurus. However, there are important levels and there are trades to be made around those levels.
One potential issue with mean reversion is that it’s not always possible to time the entry cleanly. These are trades which often benefit from a second entry at a loss. Yes, this flies in the face of the conventional wisdom that says, “Never add to a losing trade,” but that admonition only applies to certain kinds of trading. For mean reversion, adding to a losing trade can be the difference between a winning and losing methodology.
I’ve outlined several patterns around these trades, but the failure test and reversal complex are good places to start. Most developing traders will probably find better results focusing on with-trend trades, but it’s good to round out your understanding of market action by thinking about the other side.
There is also a set of trades that try to catch the end of a trend. These trades may lead to complete reversals and trends in the opposite direction (i.e., big home runs), but many of them result in sideways, choppy action. Whether you trade these structures or not, it’s a good idea to understand them.
Trade management
Trade management is at least as important as trade entry. You must know where you’re getting out if you’re wrong—you have to have an initial stop point. (This applies even more to trades in which you intend to add to the trade at a loss. Having that final stop point is the difference between a sustainable methodology and account-destroying losses.)
You also need a plan to take profits. Beginning traders would be well advised to consider taking at least partial profits when they have a profit equal to their initial risk on the trade. (Again, I know this is contrary to much of the advice floating around on the internet. Much of that advice is simply wrong. 1:1 is perfectly sustainable.)
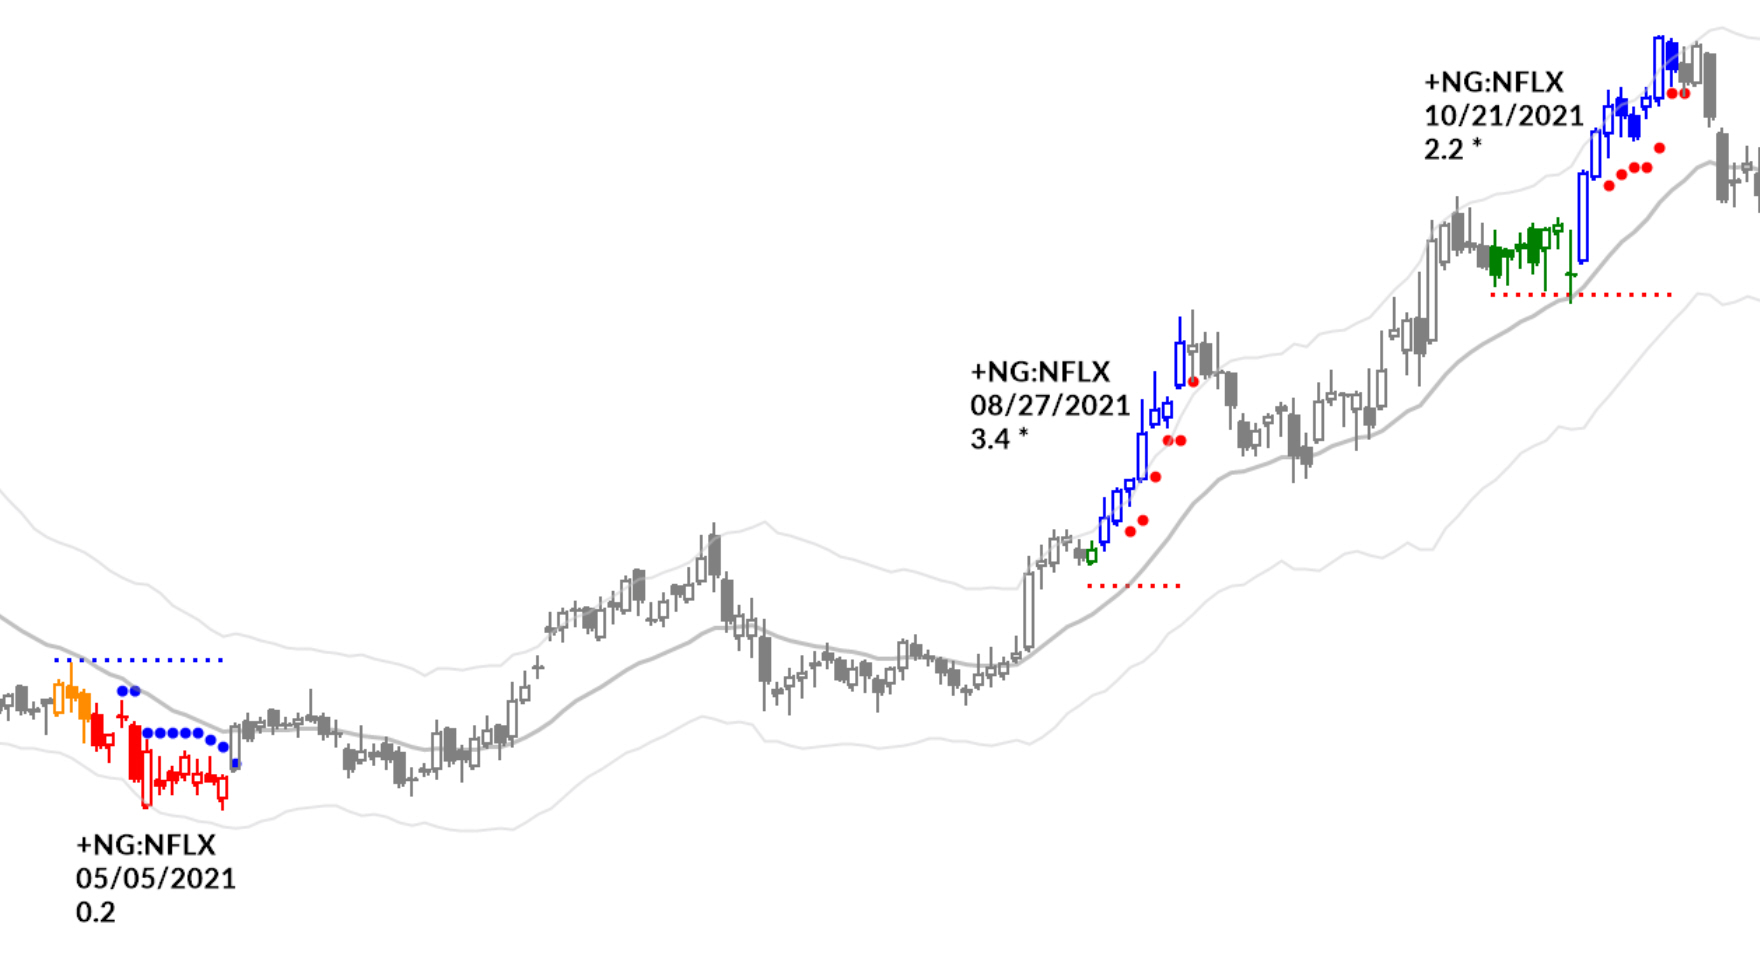
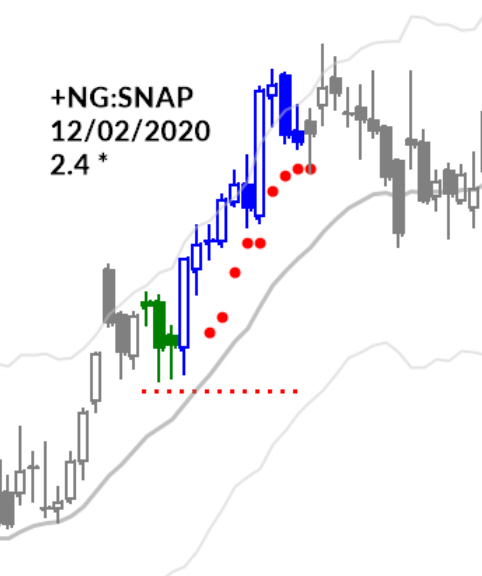
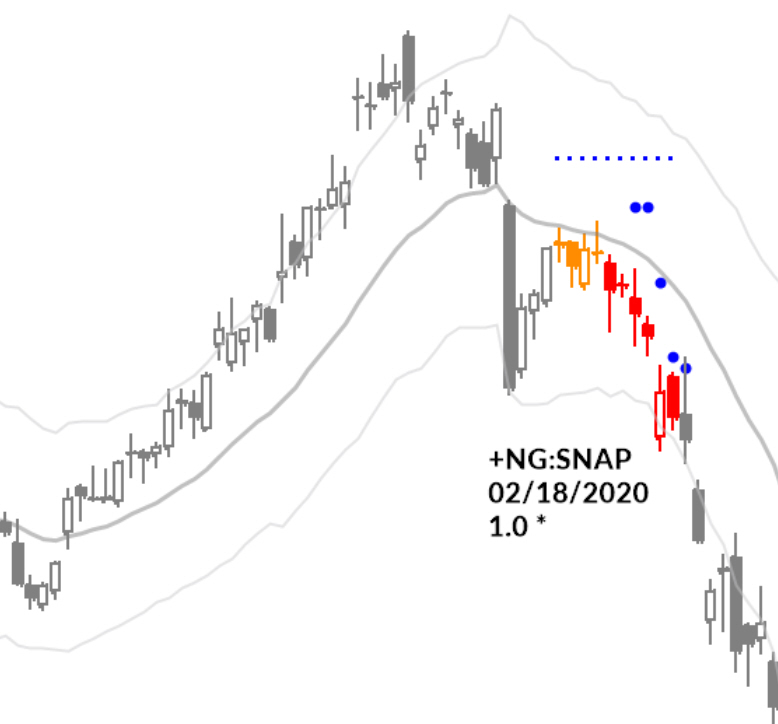
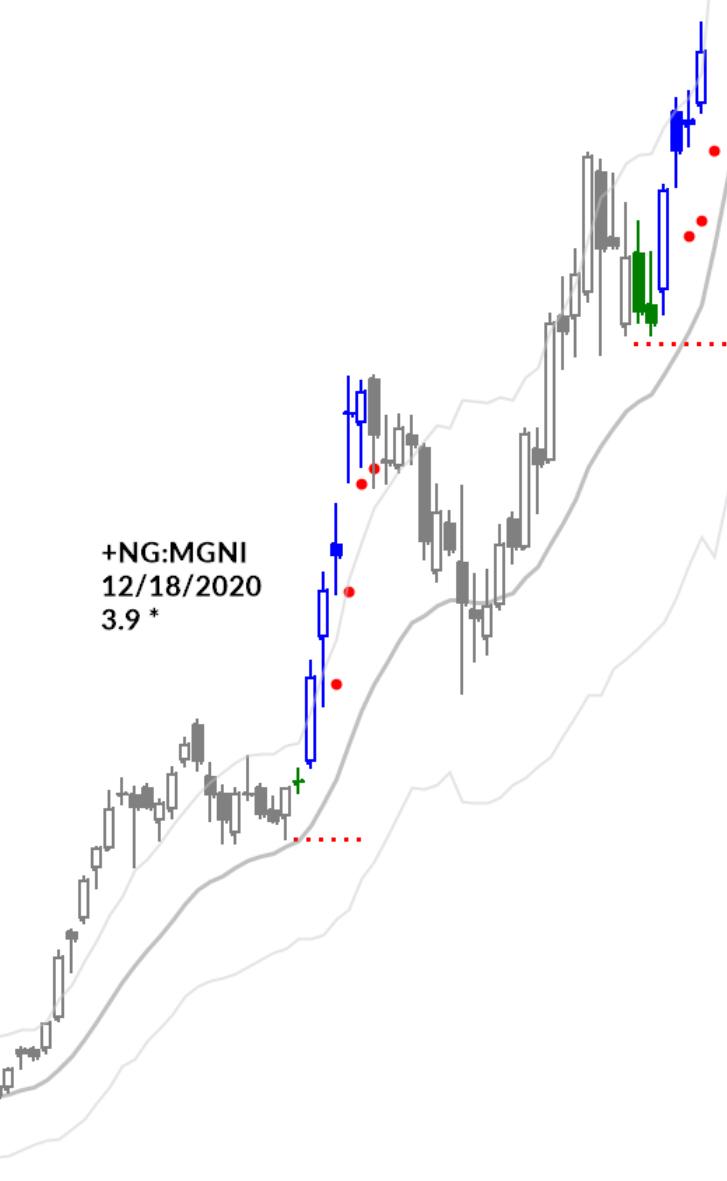
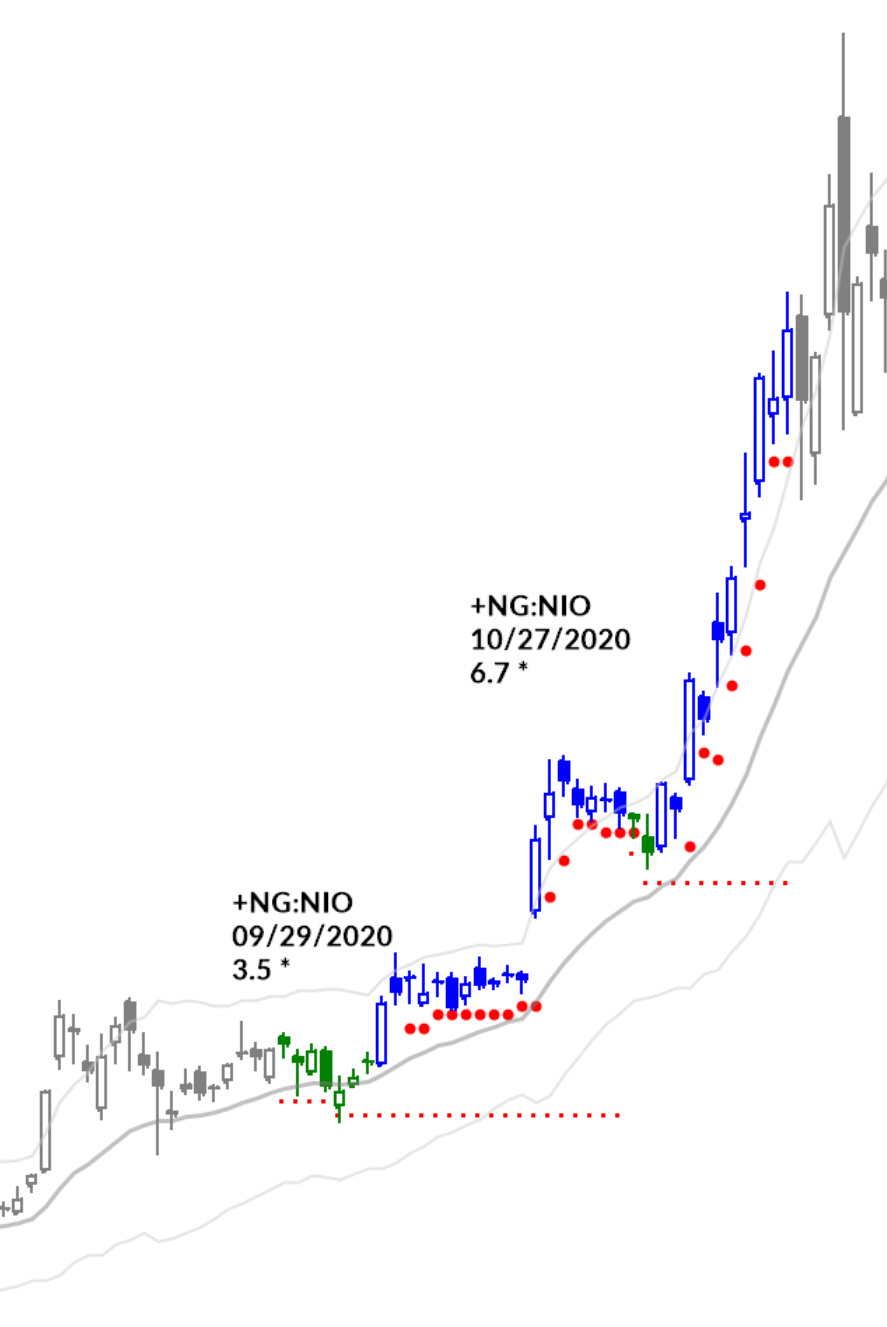
I think one of the critical issues to consider is when and how to tighten stops. This can be quantified, but human pattern recognition seems to have an edge here. To wrap this all up, here are some examples of trades, with stop levels, that were published as part of our MarketLife subscription service.
What are we missing?
Of course, there’s much more to be said. We haven’t touched on the critical aspects of trading psychology and discipline, on position sizing and risk management, or on the tasks of actually doing the work to develop and verify your edge. There are mathematical issues to consider, and it’s also worth thinking about how stable your approach might be and what to do when things change.
These layers of complexity are not as deep or impenetrable as they seem at first. In my experience teaching and training traders, the best way to learn all of this is to build it together, as a cohesive whole, but it’s important to be oriented correctly from the beginning.
There’s a lot more to say here—I’m trying to condense a lifetime’s work into 2000 words, but I wanted to outline the most important aspects of a trading approach in this short post. The details matter, but if you don’t have the big picture right, those details will never line up.
Where to go from here?
These blog posts give you a solid big-picture perspective. If you want to move from theoretical understanding to practical application, you’ve got some work ahead of you! (But good news: much of that work is a lot of fun.)
We’ve created our MarketLife subscriptions to support you in this work. Every day, you will get my analysis of markets along with solid trade setups and trade management tools. See the setups I am watching, and get access to the same screening tools I developed for my own use. As I write this (in early November 2023), many markets are setting up for some potentially powerful moves. There’s never been a better time to start learning.
Join MarketLife now for a only $7 and gain daily insights that turn theory into practice. Watch, learn, and apply what you learn, as I navigate the unfolding market opportunities in each trading day. Don’t just understand the markets—master them. Start your trial and join me in the pursuit of trading excellence.