Bands or channels are usually set up around some type of moving average. They define what is normal for a market, so excursions outside the bands are potentially interesting.
There are many ways to create bands. Two of the most common are Bollinger Bands and Keltner Channels. (We prefer Keltners for many reasons, both practical and mathematical, but that’s a discussion for another day!) With any technical tool, there should be a fairly wide range of parameters that “work”, and this is true of both Bollingers and Keltners.
There are many ways to use bands, but I want to focus on one pattern that is perhaps a little less known, and it might even be something you’re missing when you look at charts.
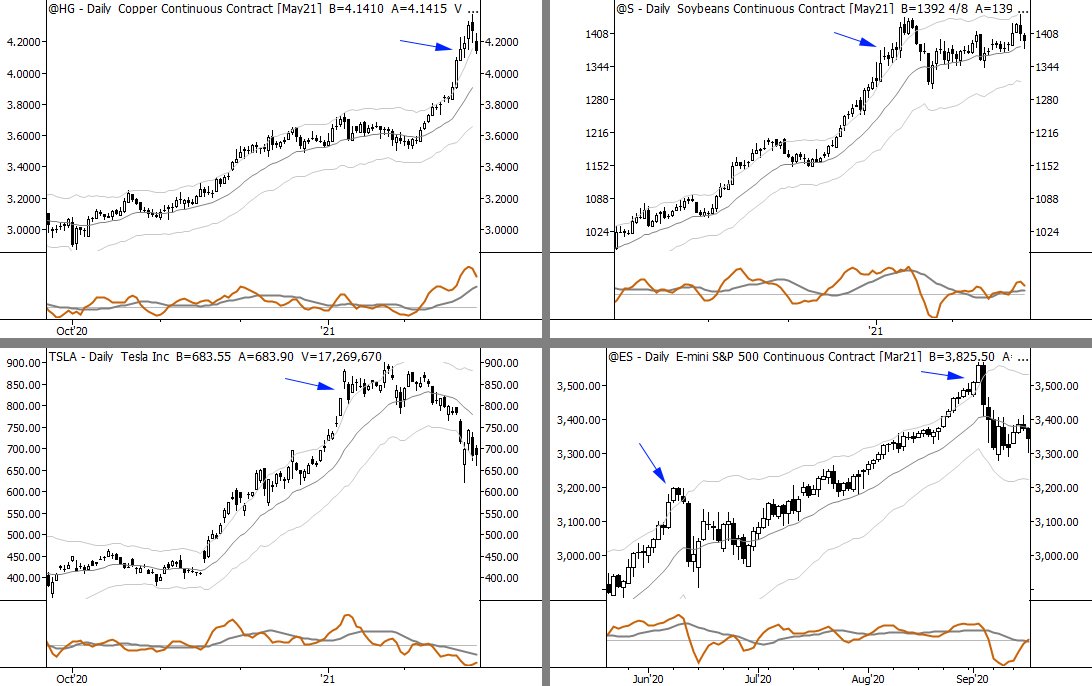
Free bars are bars that are completely outside the channels. If you were defining them algorithmically:
FreeBarUp = True if BarLow > UpperChannel
FreeBarDown = True if BarHigh < LowerChannel
The image above shows several markets with recent examples of free bars marked.
How to use free bars
Think about it like this: if the channels define what is “normal” for a market, then price touching the channel indicates an area of potential interest—the market has moved far enough to engage the channel and to press into “abnormal” territory.
If this is true, then a bar being completely outside the channel must be pretty unusual! This is true. With our settings (Keltner Channels 2.25 ATRs +/- a 20 period EMA), free bars occur on less than 4% of all daily bars. They are more common on small cap stocks (about 4.3% of all days, with some stocks having as many as 20% of the days outside the channels), and less common FX (2.3% of all days.)
Now, these bars identify areas where the market is perhaps overextended, but we also run into the problem with all overbought/oversold measures: it’s very hard to distinguish overextension from strength or weakness that will see continuation. In other words, don’t just assume that every free bar above the channel will lead to a collapse!
Here are some ideas to use this simple pattern:
- Use in a “go with” mode to identify markets that are having strong momentum moves. Perhaps look to trade in the direction of the free bar after a pullback or consolidation on your timeframe.
- Fade the move, but do so on a short timeframe. For instance, there might be an edge to shorting stocks that close as free bars and buying back on the very next open.
- Watch for multiple free bars as a sign of overextension or a potential climax to a trend move.
- Explore the differences between these patterns when they occur in mature trends, new trends, or out of ranges.
This little pattern can add quite a bit to your trading.
For our MarketLife members, we supply a daily curated list of stocks that close with FreeBars above or below the channels. This is one of the many scans we provide, and can help short term traders in idea generation or to manage existing positions.

