I’ve focused quite a bit here on quantitative aspects of trading and market analysis, and I’ve also just scratched the surface of the thorny subject of intuition. Today, I want to look at something slightly different: how we can use some subjective elements in our analysis, and how they might be relevant to the current situation in the broad stock market.
The word “subjective” usually means being influenced be personal opinion or feeling. If we use that definition with market analysis, we might run into trouble; I think the easiest way to understand what we are doing here is to contrast it with firm quantitative work. Understanding the quantifiable tendencies of a market is relatively simple. For instance, one of the clearest cases would be a stock makes a sharp move, and, all other things being equal, we’d then expect some of that sharp move to be reversed in coming days due to the force of mean reversion. If we make a practice of chasing big moves in stocks, we’re probably on the wrong side of the market so that much is cut and dried. If we consider subjective elements, it might be the “what makes this time different” aspect. Sometimes, there are several competing statistical factors, and it’s difficult to quantify everything. We could focus on mean reversion on one timeframe, a break and consolidation above a level on another, or a pattern of lower highs on another–which of these is most important? That, to me, is one of the best applications of subjectivity: knowing how to weight different, possibly competing, technical factors at any one time.
One of the problems with subjectivity is that different people may have different interpretations, and I do think experience matters here. Anyone, with no experience at all, can have an opinion about any market. (Just look at a random twitter stream if you doubt that!) But our opinions are likely to have more connection with reality if those opinions are drawn from deep experience seeing many patterns unfold, ideally disciplined and guided by an understanding of the quantitative tendencies that may be present. One more point: subjectivity is not intuition. The two are related, but not the same, and we don’t have to exercise any “special” intuitive insight to incorporate some subjective elements in our understanding of markets. Over the next few weeks, I’ll continue to delve deeper into both intuition and subjective analysis, but, for today, let’s take a look at the current situation in the S&P 500 index.
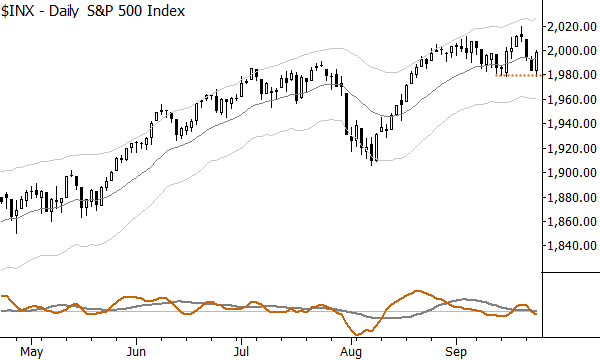
If you’re reading this later, the S&P had been declining a few days, and was approaching a potentially significant inflection. Yesterday, I wrote a post outlining the importance of a potential failure test at the bottom of the range, and how that could be a strongly bullish signal. Today (the trading day that just ended), major indexes closed with very strong gains, appearing to have bounced from that level. Here is the chart, with that level highlighted:
 Now, one thing that has been happening is that there have been a lot of bears come out of the woods in the past week. People have made public calls for a top, and the overall tone of much of the commentary has become bearish. There is always a reason–strong dollar, weak metals, slowing growth, fears of a rate hike, blah, blah, blah, but people respond especially strongly to declining prices. Today’s rally was probably primed by a lot of that early bearishness, but there is something about this pattern I do not trust. In general, I feel this is an extremely deceptive market environment, as I wrote yesterday, expect the market to do whatever it can to hurt the most people. That is an important element of market psychology that also plays into one of the reasons the market exists–markets exist to generate trading volume. Markets will move to levels that generate trading volume. In doing so, they will often key in on some of the technical structures and levels we might watch.
For this to have been a best example of a bullish pattern, I would have liked to have seen more bears get hurt. I would have like to have seen more shorts initiate below that previous pivot. A stronger pattern would have been for today to have first traded down dramatically (say 10 handles or more), and then reverse sharply to close on the highs. That’s a pattern that I could have some (subjective) conviction about, but this is not what happened. We did not clear the level. We probably did not elect stops. Probably, not enough people were hurt.
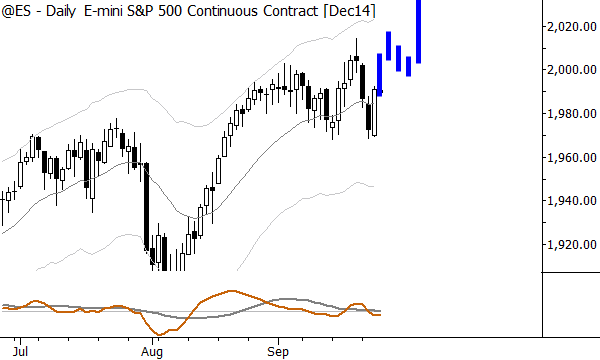
Now, we turn to watch the followthrough. If this is a strong buy, we should see very quick followthrough. Markets should trade up to their highs, maybe pause there, and then break higher, and I think this should happen within a week or two. (I think = subjective language.) I can visualize a price path that looks something like this:
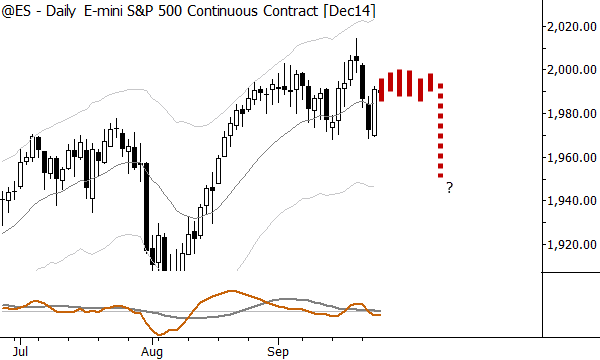
 Knowing that, I also know what should not happen. If this is a strong buy, we should not consolidate near current levels. The market should not turn lower (that is obvious), but it also should not “hang out” around here. Going flat and dull near current prices would likely be a consolidation pointing lower. If we do hang out here, much of the commentary we hear will switch back to bullish, so now, what would hurt those complacent bulls? Something like this:
I wrote this just to give you some ideas and insights into how to think about weighing different subjective factors. The quantitative structure is that higher timeframe uptrend is strong and intact, so we have to favor the upside. Subjectively, I see factors align that I think could support a flush (and this is why our research clients hold both long positions in the S&P 500 and a short position in European stocks). One more thing to consider is that, from a subjective standpoint, the landscape can shift quickly. New information (in the form of price movement) can give a very different picture in a single day, so we are always reevaluating. For now, this is what I see in the S&P 500, and I suspect the second scenario, the tricky break lower, is a little bit more likely.

Adam, how would you act on this information for individual stocks? We can obvioulsy observe plenty of failure tests on daily candles, e.g. DMND. Would you tend to skip those opportunities given that they may be driven strongly by the overall market, would you treat them independently of the market environment or would you see them even reinforced by the market environment?
Leaving failure tests on individual stocks aside, how would/do you adapt your trading? Tighten your SL, tighten them only on the short positions in case the FT works out strongly?
Also, do you approach the market differently for new positions, e.g. not open any until picture becomes clearer, setting your entry point for a breakout trade wider on short/long/both?
Would you generally screen for different things than in other situations?
Many questions here… good questions, too. The bottom line is that I would be aware of potential correlation to the market and would look for opportunities where a stock is somewhat disengaged from the market. yes, that might not last, but there’s little reason to take stock-specific risk for market returns, so I do need to be aware of that. One thing that will help is only taking failure tests that have truly “cleared” a level…as this one in the S&P did NOT do… leading to (what is obvious, today) a sub-optimal buying spot. Make sense?
Adam, you said “our research clients hold both long positions in the S&P 500 and a short position in European stocks”. Recently, S&P 500, DAX and FTSE are highly correlated. Although DAX is more volatile than S&P 500, they head towards the same direction. Aren’t these positions just a hedge? Where is the return then?
Nope… not at all a hedge, and not a spread or pair, either. These are both standalone tactical trades, but on different timeframes…the applicable concept is more like “diversification through timeframes” than hedging.
You Sir are a GENIUS. I read this earlier: “I suspect the second scenario, the tricky break lower, is a little bit more likely” – later, I saw US stock indexes break down on today’s open and have played the short side ever since. Fantastic. No one else saw this coming except you.
Thank you, but the idea is much more important than the market call. If you think about it, the thing I said was least probable was actually what happened! But… it was the idea of having a roadmap and being prepared… knowing that weakness could lead to a sharp selloff. I also thought there was potential for a second leg down in the afternoon, which never developed, but at least analysis like this tells you which bets you want to press.
Thank you. Glad you found this post useful!
Adam, why was this pivot considered an important pivot i.e is it because this was around the moving average or because we had a pretty string rally from around this level or something else.
One of the themes of my work is that moving averages, per se, are pretty much meaningless, and I’d never say anything was more or less meaningful due to its relationship to a moving average. It was simply a structural pivot at the bottom of a bigger consolidation, and this is an area from which we sometimes (not this time (yet)) see accumulation.
Fantastic Finesse … Amazing !
Thank you. 🙂 It’s good to see analysis work out, but I still think the concepts are much more important than the specifics here.