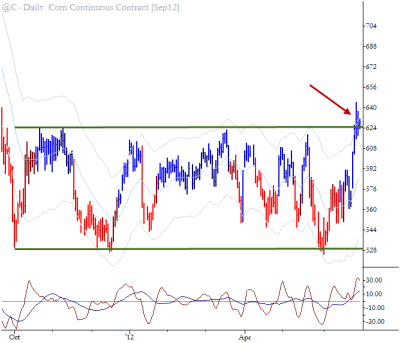
A few lessons here from the daily continuous chart of Corn futures (it’s worthwhile looking at the Sept contact along and considering the difference in patterns the roll creates, but that’s another story):
- The continuous contract has defined a clear range. The potential resistance area (always say potential resistance, not simply “resistance”) at the top of the range should create price rejection if it is going to hold. In other words, prices should quickly move down, away from resistance and should not be able to hang out near the resistance area.
- If price can consolidate near the potential resistance, it is often a sign that that resistance area will fail.
- Several small, inside days show volatility contraction on lower timeframes and set up the probability of a directional move on a breakout.
- These two factors are strongly supportive of a breakout trade. The actual entry could be effected on at least 3-4 different tactical triggers, but the important lessons are the supporting factors setting up the trade.
