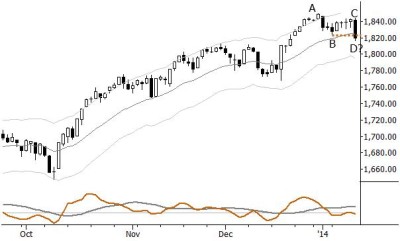
Yesterday’s weak closes in major stock indexes do threaten trend integrity, at least on the intermediate term: though fairly small on a nominal basis, these moves were large on a volatility-adjusted basis and have the potential to lead to further downside. (Bears will also find support for their case in the behavior of Asia overnight.) However, a more likely scenario than an extended selloff is a quick recovery, which would be a strongly bullish signal. Watch a potential failure test around B, on the chart, which would also leave a completed complex consolidation (A-B and C-D being the down legs—a slightly unorthodox structure since the high and low of swing D are so close in time). Flexibility, and a willingness to discount headlines in favor of price action, are essential.