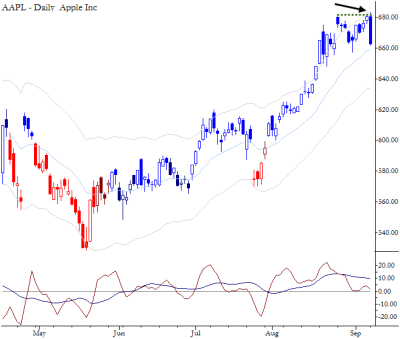
This chart shows a clean failure test in AAPL. The pattern is a brief probe above resistance, followed by an immediate failure and sharp reversal. Many traders would be reluctant to short after a move like this, as it is always possible to point to any number of “levels” that could support prices. However, there is a clear and strong statistical tendency in this pattern (which was the first trading pattern I examined in The Art & Science of Technical Analysis): shorts can be initiated on yesterday’s close, or in today’s session at the same level or higher, with a stop above yesterday’s high. Position sizing with this trade is problematic, as there is always some gap risk in countertrend trades made in strongly trending markets. Regardless, this is a pattern that demands attention.
(It is also worth considering the August consolidation in the S&P 500 as an example of how this pattern should not play out for shorts. Continued consolidation and pressure against resistance is very constructive for the bulls.)
Adam, after reading your book I can follow the argumentation of this set-up. But you also mentioned in your previous post the current strong upside bias of S&P 500 on any time frame. Now I could not imagine the SP500 making new highs w/o AAPL. How do you account for this type of considerations? Are you reducing size, looking at different time frames, ignoring etc.? Thanks for the book and for this blog!