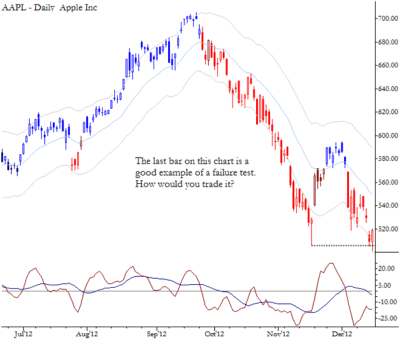
One of my most reliable patterns has been the simple failure test, which you will also hear called a bear trap, or a 2B entry. This is also one of the simplest patterns to illustrate, and so was the first trading pattern I chose to cover in The Art & Science of Technical Analysis. In this trade, we see a market make a probe beyond (below for support, and above for resistance) an important level, and then quickly reverse. Conceptually, it is not wrong to think that the market has simply run the stops, but found no conviction beyond the level.
Some things to think about here: there are risks. The correct entry is to go home long AAPL on the close, with a stop somewhere around yesterday’s low, but there is always the risk of a gap down opening that doesn’t look back. Under this scenario, your loss can be several times your anticipated risk, so I often suggest trading this pattern on smaller risk than your other trades. Note also that you should consider expectations from this pattern. This is not a pattern that, alone, is likely to set off a major inflection (though it can mark one if supported by other factors.) In this case, the preponderance of evidence points down, so perhaps use a signal like this to initiate a nimble countertrend play for the short-term, or to take partial profits on existing short positions.
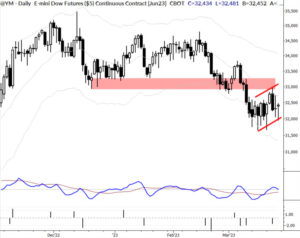
Adam, what makes your candles change from blue and red?
Looks like the Elder impluse system.
It’s a variation of Wilder’s Parabolic: reverses colors when price moves 2.5 ATR’s off a previous pivot high or low.