It’s great when all stars align and every signal tells you to do the same thing. That’s the idea behind multiple timeframe analysis (which, by the way, is a topic that should be more controversial!)… imagine the profits that can result when forces on different timeframes roll in the same direction, but what do we do when there’s conflict? What do we do when the signs are confusing?
I want to share an example from a recent trade I got wrong. There are two levels of lessons here: first, some thoughts on multiple timeframe analysis. Second… and maybe this is where the real treasure is… thoughts on professional trade management and selection.
Multiple Timeframe Analysis
There are many ways to do multiple timeframe analysis. Perhaps the most common is look for a case where a trend is clear on the higher timeframe (e.g., weekly chart, if you trade daily) and then to only trade in the direction of that trend. While this has the advantage of being very logical, I don’t think it can be applied in a vacuum. If you use any of the common trend definition techniques (e.g., ADX, confluence of multiple moving averages, slopes of moving averages) you’ll find they lag so much that they actually put you on the wrong side of the market. This is one the less-known and dirtiest secrets of technical analysis: by the time your trend indicator flashes an “all clear”, you’re on the wrong side of the trend.
Saying this puts me in conflict with some famous books and gurus, but it won’t hurt my feelings if you disagree with this. You’re not disagreeing with me, you’re disagreeing with the data. Do your own work and see what the data actually has to say. (This blog post is a good place to start if you want to do your own work.)
A better way to use multiple timeframe analysis is to find patterns on the higher timeframe that have a statistical edge, and then to respect those patterns. A bull flag is a good example; this is a pattern that says, very simply, the market is a little bit more likely to go up than down. Check out this bull flag on the weekly chart of gold futures. (All charts in this blog post are from a few days ago.)
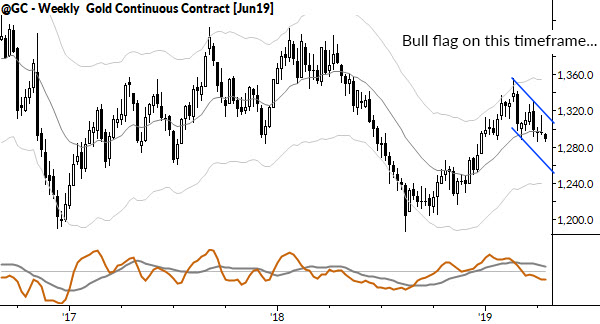
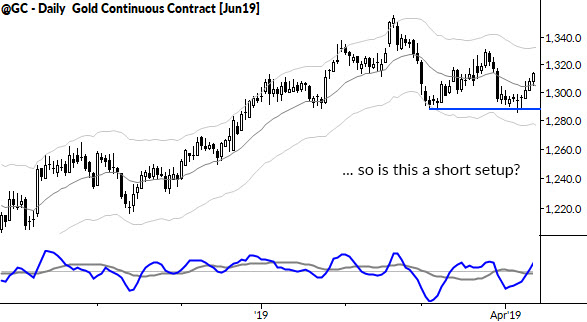
When we see a pattern like that, I know that we will, on average, be on the right side of the market if we buy—this pattern has one of the strongest statistical edges of any price pattern. So, what happens when we see a pattern like this on the daily chart? A bounce that might be setting up a short:
From analysis to trading
Well, what happened in this case was that Tom pointed out the potential short in gold, and I immediately dismissed it because of the higher timeframe conflict. (Stick with me here, I had to eat my words in a few days!) This is one of the more effective ways I’ve found to use multiple timeframe information: when you see a trade that clearly conflicts with a higher timeframe tendency, don’t do that trade.
It’s the opposite of waiting for alignment—use conflict to show you which trades to avoid, rather than using alignment to show you which trades to take. This works better because it avoids the issue of lag; by the time you have alignment, the trend may be ready to turn. Alignment requires a zone, while conflict is often more of a point in time, and that point in time is powerful.
So, I used a proven technique to skip a trade, but a few days later, we found ourselves short, we had published the trade for our MarketLife and Talon Advisors clients. The trade worked out very well and melted through the first profit target on the short, and a few days later we’ve tightened the stop below the entry price, essentially locking in a risk-free trade. Here’s the chart of gold futures today:
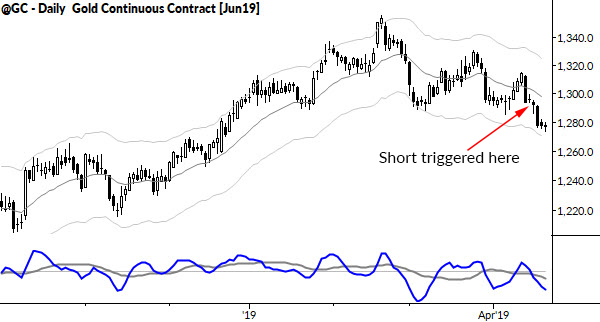
So why and how did this happen? First, from a technical perspective, chart patterns fail, even high-probability chart patterns. The bull flag on the weekly was not set in stone, and I’m aware of three broad ways flags fail. (See my first book for details, but those three ways are 1) strong momentum against, 2) failure at the previous pivot, or 3) failure of momentum.) The action over the next two days suggested the emergence of downside momentum on the daily, and that’s one of the ways a higher timeframe pattern starts to crack.
There’s also a behavioral aspect to this, and a delicate balance: once I decided it was not a short, I kept looking. I kept taking in new information, and adding it to the analysis. Though I had rejected the short with complete confidence, conditions had shifted enough two days later to justify the short entry.
That type of balancing act is hard to do, and it took me a long time to learn it. We can err on either side–revising our view constantly or being stuck and inflexible. One thing I can tell you with certainty is that emotional balance is critical for this type of analysis. If you find yourself having emotional reactions to market moves, you can’t see or think clearly. Managing those emotions, finding that emotional balance so we can have the intellectual clarity–those are some of the main tasks of trading.
So, I had to apologize to Tom for “pooping” on his short idea. (Though his reply was “what are you talking about? We’re short, aren’t we!?”) I think there are some important lessons here:
- The idea of using multiple timeframe conflict to filter trades, rather than confluence to confirm
- Being open to new information and revising your read of a market
- Balancing all of this in context of trade entry and trade management