 [dc]I[/dc] want to share two statistical “studies” with you. Both of these were done this weekend, using the cash S&P index from 1/2/1987 – 10/14/2011. Both show a strong and convincing edge. Without further ado, let’s dig into the results.
Study #1 – Bearish Bias
Sell short on today’s close if all of the following are true:
- Today’s close is under the 200 day moving average (indicates a weak or bear market)
- Today’s close is the highest of the past 20 closes and the 3 period RSI > 80 (shows overextension)
- The highest 20 day historical volatility of the past two months was greater than 40% (suggests an emotional, volatile market)
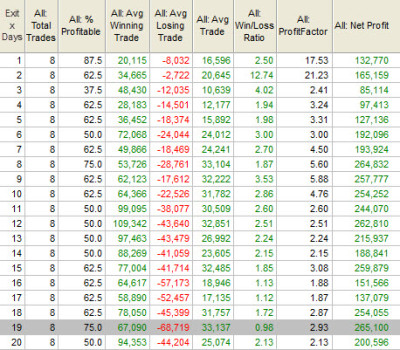
The table that follows shows the results of this system, with $1MM invested per trade, exiting on each of x days later:
Take a minute to make sure you understand the table. System results can sometimes be highly dependent on the exit point, so each row of the table shows the results of exiting on that day following the signal. We should, in general, be suspicious of a system that showed a strong edge on only a few of the days. In this case, the results appear to be fairly stable for a month (20 trading days) following the signal conditions, so it does appear, based on this test, that we might have a valid system. Winning percentage (remember, this is a short system, so that is the % of time the exit on that day is below Friday’s close), is fairly consistent, but the system is profitable on all days following the entry condition. Note especially the very dramatic Profit Factor on the first two days, showing that the winning trades were, on average, much larger than losing trades.
This system triggered another entry on Friday’s close. If we accept this test at face value, we should have gone short on Friday’s close. However, let’s look at another study:
Study #2 – Bullish Bias
Buy on today’s close if all of the following are true:
- Today is a Friday (“seasonal” day of week tendency)
- This week’s range was less than the previous week’s range (avoiding overextended market)
- Both this week and the previous week closed up (positive market tone)
- Yesterday was a down day, but today’s close higher than yesterdays (very short-term pullback pattern)
- 20 day historical volatility is greater than it was a week ago (avoiding flatlining markets)
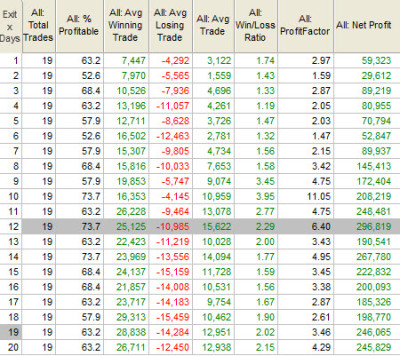
The table that follows shows the results of this system, with $1MM invested per trade, exiting on each of x days later:
Uh oh. Based on this test, it seems we should have gone long on Friday’s close. This system also shows a consistent edge out to the end of the test window with good percentage of wins and a stable profit factor. This system also looks good–what is going on here?
Ok, so obviously neither of these studies is intended to be valid, the point of this post is to raise a caution about statistical studies. In this case, I sat down and created these two studies in 20 minutes, knowing exactly what I was doing, but what if I just found one of them by accident? Many bloggers, traders, or analysts do exactly this, and then publish the results with conviction. In many cases, they are victims of bad math and poor research methodologies; I believe there is rarely if ever any intent to publish misleading information, but I could easily have spun either of these flawed studies into a 2,000 word research report. How can two studies show such a strong edge in opposite directions using the same data and the same entry point (Friday’s close in this case), and, more importantly, how can we avoid these mistakes?
The bad news is that there is no sure-fire way to always avoid these errors, but some guidelines will help. I am extremely suspicious of any work done by anyone else, with few exceptions. Learn to do your own studies, and you will learn to trust your results as you see them play out over many years. Also, be very suspicious of any results presented in a format similar to what I’ve done above, using a standard system output from software. There are many other questions that need to be asked, the most important of which relate to variability (tests of statistical significance) and stability over time. The biggest red flag with either of these tests are the number of trades. There were roughly 6,200 bars in the test universe, so finding a system that has less than 20 trades is not impressive. Always, always, always be suspicious of small sample sizes. (For now, let’s ignore the fact that these tests were done on the Cash S&P Index, which is not tradable per se.)
One last guideline might be helpful if you are thinking about doing your own research: Both of these tests may have too many conditions. It is very easy for an analyst who wants to prove a point (whether consciously or not) to add conditions, modify them, remove and try others until a magical combination is found. This is perhaps the main reason to do your own work: if you are trusting someone else’s tests, you usually have no idea what exact procedure was used or what subtle biases might have been introduced. If you are using a test someone else did, be very careful if it includes more than two conditions.
We’ve all heard the saying, “if you torture a dataset long enough, it will confess to anything.” With market data, sometimes it does not take that much torture, and bad statistics can lead to costly errors for traders at all stages of development.
If you’re interested in experimenting, here is the TradeStation system code that produced these results. Optimize for the input x which is the exit day, or set it to a specific value.
inputs: x(10);
vars: hvr(0), sprd(0), xx(0), yy(0);
hvr = hisvol(c,20) * squareroot(262);
sprd = highest(h,5) - lowest(l,5);

If C = highest(c,20) and c < average(c,200) and highest(hvr,40) > .4
    and rsi(c,3) > 80 then xx = -1 else xx = 0;

If dayofweek(date) = 5 and sprd < sprd[6] and c > c[6] and c[6] > c[11]
  and c[1] < c[2] and c > c[1] and hvr <= .35 and hvr > hvr[5]
  then yy = 1 else yy = 0;

 yy = 0;
 If xx = -1 and lowest(xx,20)[1] > -1 then sell short this bar close;
 If yy = 1 and highest(yy,20)[1] < 1 then buy this bar close;

If Barssinceentry >= x then buy to cover this bar close;
If Barssinceentry >= x then sell this bar close;


So in almost 25 years these systems traded 8 and 19 times?
perfectly done
thank you!