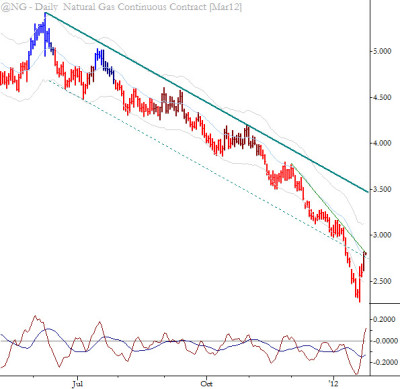
[dc]T[/dc]his chart of Natural Gas futures shows a classic pattern: parabolic acceleration outside the Keltner Channel and the parallel trendline. It is difficult to play a move like this as a fade (i.e., buying for a long) due to potentially unmanageable volatility, but it is always a clear signal to traders positioned on the right side of the trend to tighten stops, perhaps take profits, and avoid shorting into the countertrend pop. In the words of the old Samurai maxim: “after victory, tighten your helmet straps.”
