Where the wild things are? No, where the open is.
The open, in many ways, is the most important price of the day; action off the open can often define the character of the entire session and even have implications for following days. Even if you are a longer-term trader, there are elements of short term price behavior you should understand. There are times when we need to look shorter-term for risk management or to nuance trade entry and exits, but, even more important is that many elements of price action scale between timeframes, and this is one of those elements. Understand how the day unfolds and you will make great strides toward understanding weeks, months, and years.
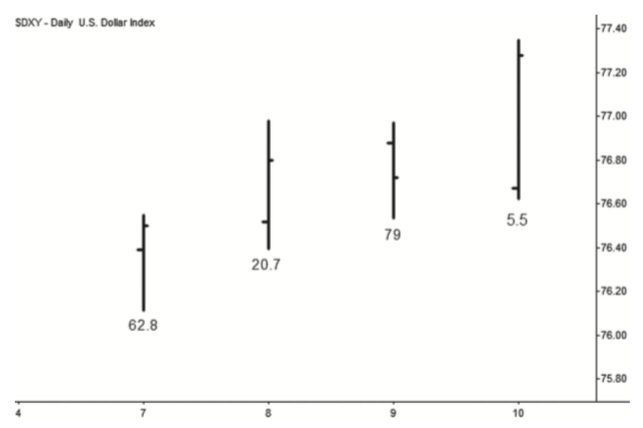
First, we need to create a measure of where the open lies in the day's range. For each day, calculate OPR (Open as Percent of day's Range) as:
OPR = (Open - Low) / (High - Low)] * 100
It is important to understand how this works, so here is an illustration:
Now, the first question we should ask is what does this measure look like, across a wide range of market data? (Many of the figures in this post are from the unpublished sections of my book. I elected not to publish about 450 pages that dealt with the statistical support for market structure and the trading patterns I use.) Here is a histogram of the OPR stat for an active market universe comprising about 46,000 daily bars, drawn from stocks, futures, and currencies. Note that the open is not evenly distributed throughout the day's range:
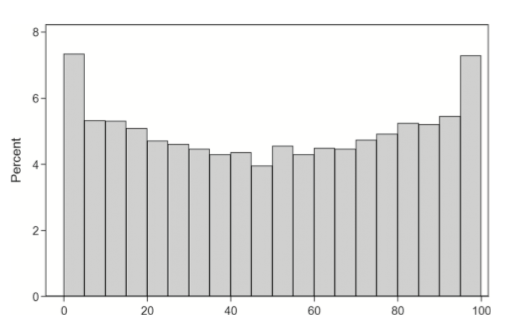
It is important to understand what this graph is showing. For each of the daily bars, the OPR was recorded, and they were put into "bins" corresponding to the bars above. From this histogram we can see that the open clusters at the high or low of the bar more often than in the middle. ((This is not, as has been erroneously stated, evidence that markets deviate from random walk. Random walks exhibit this same distribution of the open due to something called the arcsine law.)) This is a repeatable element of market structure on all bars from intraday to yearly--the open tends to be near the extreme of the range. This fact is not, in itself, a trading edge, but keep reading.
Now, let's look at the OPR stats for the S&P 500 futures, day session only. Here is the OPR for 4,297 daily bars, going back to 10/1997:
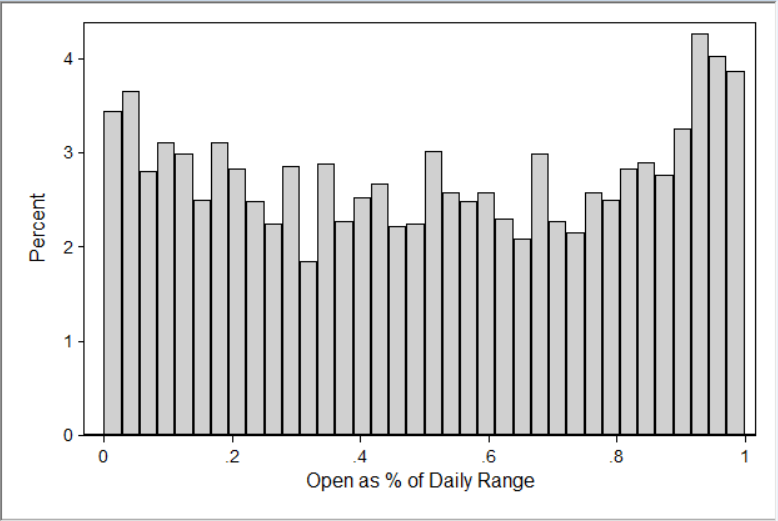
Now, this doesn't look quite like the chart above, but this is probably just a reflection of the considerably smaller sample size--statistical noise. There's no reason to think the S&P futures behave any differently; this is normal variation we would see looking at any single market. Still, we can see the same rough tendency--the open tends to be toward the extreme of the day (high or low) more often than in the middle. This is mildly interesting, but hold on to your hat. Now, look at this:
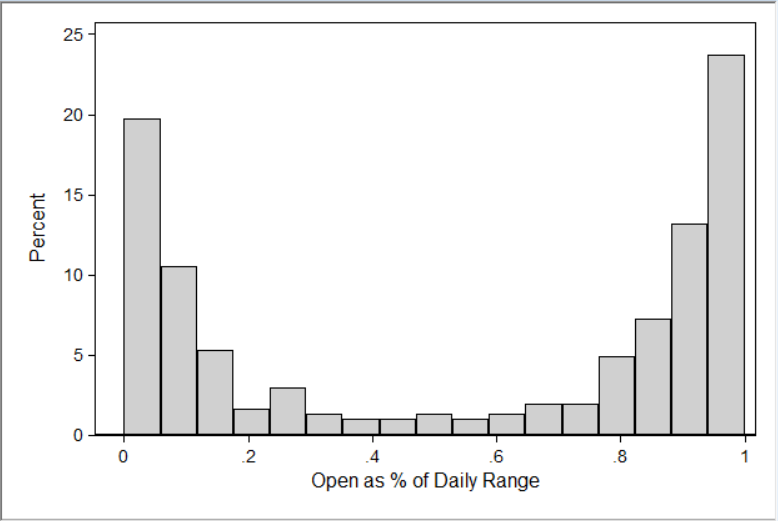
Ok, first of all: wow! Assuming we have not made a mistake (that should always be your first assumption when you see something this good in the data), we have something that seems to be very significant. The chart above shows the OPR stats, but only for days that were larger than 2 SigmaSpikes ((SigmaSpikes is a volatility-adjusted measure, expressing each day's close as a standard deviation of the previous month. Volatility-adjusted measures are far superior to simple percentage measures when looking at large days in markets.)) , up or down. (There were 304 of these days, about 7.1% of all trading days.) What we can say here is that on large range days, the open tends to very near the high or low of the day with amazing regularity.
What do we do with this information? Turns out, a lot--you could base an entire trading program on this concept--this is a real gem. One thing to keep in mind is that we do not know at the open if the day will be a large sigma day or not. (Remember the warning of this post about using future information that would not be available in a study. We could be on thin ice here.) The point is not to predict the day's range, but to use market action off the open to set up trades and to get a better read on the probabilities for the day as it unfolds. Here are some ideas to consider:
- There are about 1.5 of these large range days a month, on average (though they are not evenly distributed). Most active daytraders find that the bulk of their profits come from 1-2 big days a month. There is a connection here.
- For intraday and short-term traders, these large range days are very important. Many traders choose to focus on "good days" like this, and knowing how market structure unfolds off the open can tell us how aggressively to trade that day.
- We have just seen that large range days tend to have the open near the extreme of the day. This means that you don't have to give large range days much room on the other side of the open. For instance, if you buy an upside breakout off the open looking for a trend day, the chances of that trade working shrink if the market trades very far below the open. Now you know where to put stops, why reversing for a trend day in the other direction is problematic, and, in general, how to better manage intraday trades.
- If a day has a moderate range in the late morning and has traded on both sides of the open already, there is not a high chance of the day being a solid trend day.
These are ideas, and you can extend this concept in many ways. This is one of the most important elements of daily market structure, and is the driving force behind so many other patterns (for instance, many candlestick patterns are shaped by this dynamic). Watch for this tendency, do your own work, and see how you can incorporate it into your own process.

