The power of an inside bar
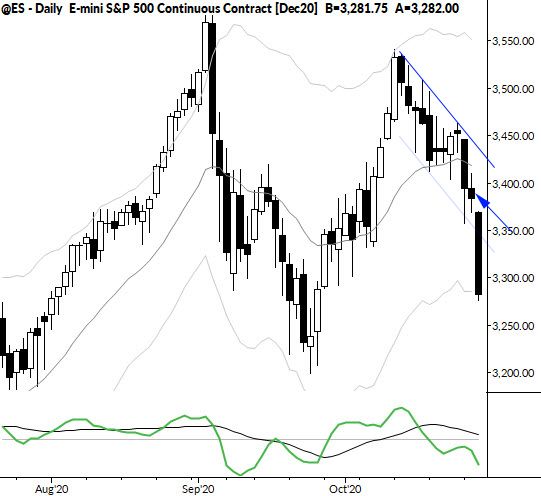
Just a quick lesson here, but an important one. Take a look at the chart above. Was there anything that could have helped us predict the breakdown on that last bar?
There's a lot going on on any chart. In this case, we had a long bull flag that was in the process of perhaps breaking down. It had gone on a bit "too long" and was challenging the downside boundary of the pattern. (We discussed this in our Member's videos every day at MarketLife.) While this might have put us on guard, it wasn't enough to trigger trades.
It's also worth mentioning that this is being written late in October 2020, just before the US Presidential elections, in the middle of the COVID-19 crisis as the world appears to be facing escalating infection rates, and in the aftermath of some failed political negotiations to create another US stimulus package. All of that brings uncertainty, but, again, it's not a trade trigger.
The trigger is something simple. Look at the penultimate bar on the chart, marked with a blue arrow. That's an inside bar, and inside bars can be powerful signals.
What's an inside bar and why do we care?
Inside bars are bars where the high is below the previous high and the low is above the previous low; the range of the bar is completely inside the previous bar's range. They generally show consolidation and often bring no new technical information to the table.
We often ignore inside bars, but they can be very powerful when the follow a larger-than-average bar or come near a critical level.
In this case, the bar was probably just enough consolidation on the lower side of the bull flag to set up a breakdown. Traders looking for short entries could have shorted a breakdown of the previous day's range (though you would have needed to catch it in the overnight session. This is often the case with stock index futures.)
These breakouts tend to be short-lived signals, so it's not easy to make longer-term forecasts based on this pattern. But take a look at your trades and see how many of them might have been improved if you had looked for entries on breakouts of inside bars.
At the very least, you don't want to be on the wrong side of such a move. If you find yourself buying weakness on a breakdown like this (or, flip the chart, and imagine shorting strength on an upside breakout), you're likely on the wrong side of the market.
See what this signal can do for your market analysis and chart reading. Small bars can make a big difference.


