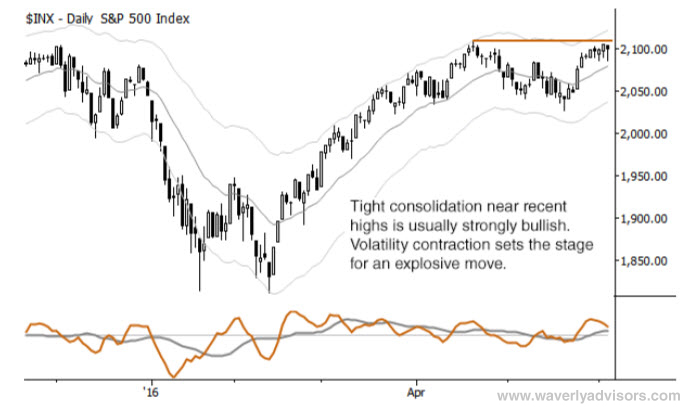
What's going on? Thinking conceptually about patterns.
When I started trading, like many people, I was drawn to traditional technical analysis. I spent hours and hours studying different variations of patterns, often after creating the charts myself on graph paper. I measured ratios, looked at different kinds of averages, relationships of highs and lows within bars within patterns, and basically tried to dig as deeply into the minute details of patterns as possible. After I was fortunate to make some money trading, I started to take an objective look at what I was doing, and realized that the classic 80/20 rule applied, albeit in a different way--over 80% of what I was doing was a waste of time! So much of it didn't matter.
Every tick matters?
I've come to think that there are two ways of thinking about patterns. One is what I might call "detail oriented", and many of the classic charting approaches fall into this category. We might talk about the differences between pennants and flags, and we might also think about where they fall within the bigger picture. Something that looks like a rising wedge could have a very different meaning if it comes after a sharp drop, in the middle of a quiet market, or after a strong advance. (This is what we mean when we talk about context for patterns, and is what many people are looking at when they consider the higher timeframe.) This approach is also carried through in many of the modern books that run into the thousands of pages, looking at the details of every single bar. These approaches are compelling because they offer us answers--authors can create some logic to explain every tiny jiggle of every market in retrospect, but I think there may be a problem with all of this.
The problem is that markets are highly random and full of noise. Yes, there certainly are meaningful things that happen in markets, and sometimes exact, precise things are important. However, I've come to believe that most of what we see is misleading at best, and dangerously seductive at worse. For one thing, not every tick matters. When you've traded long enough to see markets move for stupid reasons or for mistakes, you come to realize that it is not, in fact, all part of some grand scheme. Thinking back to 2007 when I was at the NYMEX, I've seen gold futures make a gigantic intraday jump just because a legendary trader walked into the pit. Why did he do so? Basically, he was bored so he went down to the floor. Other traders, in a quiet afternoon market, saw his arrival as a possible harbinger of doom, and activity in the futures took off. This, by the way, is not an isolated incident--this kind of thing happens all the time, for silly reasons. Also, many of the prints you see are simple to mistakes or maybe due to action in related markets. (There's a nasty spike on your XLE charts a few years back that was caused by yours truly making a trading error hedging a large position and clearing the book on both sides. Oops.) If you're trying to divine meaning from every tick, I think you at least must acknowledge that a good percentage of what you see is meaningless, and then you can begin the task of separating out what matters from everything else.

Thinking conceptually
There's another way, and, I think, a better way. Rather than focusing on the details of patterns, we think about what is happening. Consider this situation: a market reverses strongly off the lows, shoots higher, and then goes quiet without backing off much. I would argue that this is a market consolidating to go higher. (The chart above of the S&P 500, drawn from the research report I wrote this weekend, is not in this blog post by accident...) That is what matters; get the big picture, get the direction right, and everything else is a lot easier. Do we need to spend time analyzing that consolidation? Do we care about the exact shape, how the sides slope, or exactly what retracement ratio it holds? I don't think so.
Focusing on the concept behind the pattern gives us a big picture trading plan. Looking at the chart above, we see clearly that we need to be long. (By the way, if you strongly disagree with that statement, ask yourself two thing: first, if you did not know that it was the stock market, how would you feel? Second, why do you hate the idea of being long so much? If you come up with an answer having to do with job growth, Fed action, the price of oil, etc... you may have a well-reasoned argument, but I think you may have trouble making money trading.) Now, there are some legitimate challenges with this approach. When we get in or out of the market, we must do so at precise prices. How do we reconcile a kind of "fuzzy" big picture approach (strategic view) with the need to have precise execution points (tactics)? It can be done, and I'll show some ways to do so in tomorrow' blog post.


