What can we learn from the range?
Markets broadly exist in two states: trends or trading ranges. In other words, a market is happy with the current price (and accepts it) or is moving to another price.
Of course, this makes everything sound a bit more predictable than it actually is: trends can seemingly go on forever, or end suddenly without warning. Ranges can hold with cleanly-defined boundaries, or they can show all kinds of false breakouts.
Generally speaking, trading in trends might be a bit easier for discretionary traders; trends tend to have more readable patterns and are slightly more predictable. Books like to show idealized examples of trading in ranges, where, for instance, we buy at the bottom of the range, sell near the top, get short near the top, and repeat until it breaks out.
In reality, it's not so simple: bounces from the confines of a range may only move a bit into the range before retesting the levels. Breakouts can come without warning (and even on gaps), and breakouts can quickly fail back into the range. In my experience, this is a very painful way to make money in the market.
However, there's good information that we can derive from where a market sits in its range and how it acts around the boundaries of the range. The cleanest ranges will actually be set up by trends: the two critical levels are the trend extreme (the low, in this chart), and either the first reaction after that trend extreme, or, more rarely, the last pullback swing before the trend ends.
A chart will help to clarify:
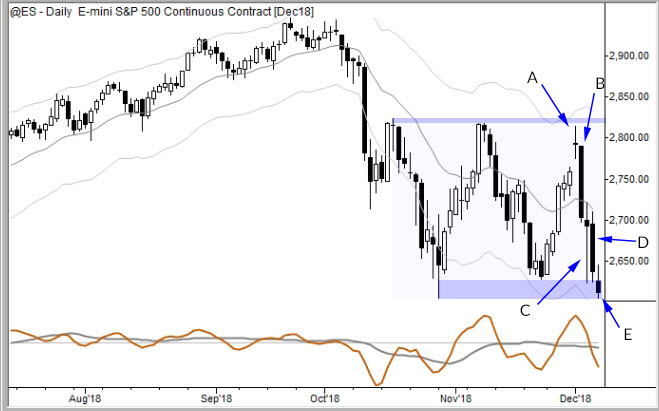
In this case, we've defined the range with the horizontal lines. Rather than thinking about trading within the range, let's consider what information we might have extracted from the market on each of the last few bars:
A. The market takes a pause near the high of a unbroken run of six dramatic rally days off of support. This is undeniably bullish price action, and the doji bar is a natural pause after such a strong run up. Our baseline expectation going forward should be bullish here. (Even though that proved to be dramatically wrong!) We might expect a few days of consolidation, probably holding somewhere near the top of the range; 2,775 is a good reference, but not a line in the sand. We should be prepared for some false breakouts to the upside, because we know that levels are wide ranges, not exact prices.
B. Well, this "should not" have happened. This is a strong contradiction of our bullish bias from just one day ago. Now, however, we are simply back in the middle of the range. Though this is the most dramatic bearish candle we've seen in many weeks, we're still mid-range. We've still only seen price rejection from the previous highs. We're still rangebounce. Baseline expectation here should be to drift, and probably to test the lows eventually. Bottom line is I would walk away from a day like this saying "no clear short-term bias", and that's ok. That's realistic. It's not often we can have a strong bias.
C. Incredible, dramatic conflict on this single bar. It's easy to miss this when we simply look at a historical chart, but consider the dramatic downside extension to support, and the equally dramatic price rejection from that support. (I've used the word "dramatic" three times in two sentences, and that's not an accident.) From the perspective of a short-term trader, this is frustrating because, once again, we close mid-range, with no clear directional bias.
D. This is the day where things get truly interesting, and where we're able to find an edge: a more measured decline from the middle of the range, and a close that puts pressure on support. Though this is not a standard breakout setup, the market dynamics here clearly favor a downside breakout of the range.
E. This bar is not yet closed, but trading down into the support area is a classic precursor of a break of that support.
This thought process--thinking from the perspective of a short-term trader--is critical to understanding market action. We are not suggesting you make those trades (or even that they could have been executed at the time), but understanding where a short-term trader might have had expectations (e.g., the low of C, expecting a breakdown and flush below support) and seen those expectations frustrated can give us good insight into market dynamics.
Last, you cannot have an opinion on every bar. New traders feel that they should be able to look at a chart and predict something at every turn. I have not found this to be the case. In fact, most of the time (80%+) a chart tells us very little and the best we can say is "I don't know."
It's not a personal failure: it's an acknowledgement of the limitations of knowledge and the random, conflicted nature of price action in competitive markets. This is reality. If you're going to trade well, it's best to align yourself with reality!
Also, understanding where there's no edge allows you to focus on those few times where there is an edge. (See bar E!)


