One skill that is often overlooked in chart reading is the ability to look at a bar on a chart and to infer what price action might have created that bar. In practical terms, this means being able to look at a bar on one time frame and immediately understand the most likely lower time frame scenarios that could have created that bar. In almost every case, there are multiple possibilities, but some are much more likely than others. It is not necessary to be 100 percent correct on this; sometimes we will simply guess wrong, but working to develop this skill will greatly increase the trader’s intuitive grasp of price charts. For instance, consider the single candle blow with an empty body (meaning that the close was higher than the open) and with moderately small shadows on the top and bottom.
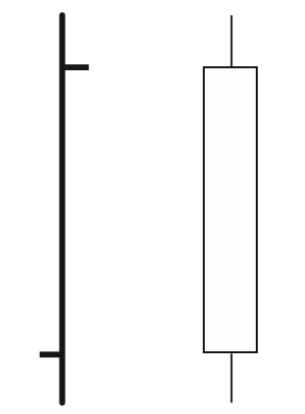
There are three things we know with certainty about this candle: the close was higher than the open; at some point, the market traded lower than the open; and, at some point, it traded higher than the close. Most people with a little bit of trading experience would assume the candle opened, traded down to put in the low, trended up to make a high, and backed off to close under that high. This is the most obvious possibility (scenario #1 below), but there are many others, some of which are also shown.
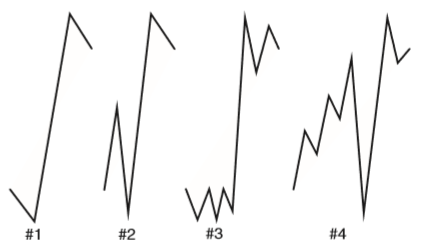
Traders developing a sense for price action need to spend a lot of time contemplating all of the lower time frame scenarios that could produce each bar. Being locked into a single interpretation without considering the context can blind us to what might really be going on in the market.
Though charts contain a lot of noise and random action, there are points where structures within individual bars, or a small set of bars, are very important. One simple pattern to think about is that the location of the closing point relative to the high and the low of the bar may give some insight into the buying or selling conviction within that bar. For instance, a close near the high of the bar usually shows that buyers were in control going into the end of the time period. Yes, there are other possibilities and patterns that could have created the close near the high, but, more often than not, buyers were in control. Conversely, closes near the middle of the bar, visible as long shadows on candle charts, show a certain neutrality and lack of conviction. It is also worth considering the extreme case where several bars in a row close on their absolute highs. Many traders would assume that this is indicative of a very strong market, but, statistically, this condition more often indicates short-term exhaustion and at least a slight reversal—be careful of entering with the trend after several bars close on their highs
(pp 22-23 of The Art and Science of Technical Analysis)
Yes ! Candle on Higher TF ~ Swings on intermediate TF ~ Trend on Lower TF –> Also to consider is the fact that With respect to time Charts.. The close of the Bar is relative to the passing ie. closing of the Hour. Also Looking forward to your Next unit of Multiple Timeframe Unit of Your Trading Course ( At your Convenience, of Course ! )…
Thank You for Your Insights & Help
thank you!