S&P 500 futures activity by time of day
Most people know that stock markets tend to be much more active on the open and close, and are often "dead" in the middle of the day. This is important information for everyone. For intraday traders, the need to focus trading activity on the open and close is obvious. But even for position traders, knowing how and when the market is moving on lower timeframes and understanding liquidity through the trading day can add significantly to the bottom line.
Last week, I updated the market stats around time of day tendencies for the S&P 500 futures. This is an aspect of market behavior that I had believed to be rather inflexible, and I was surprised to find some significant shifts over the past decade.
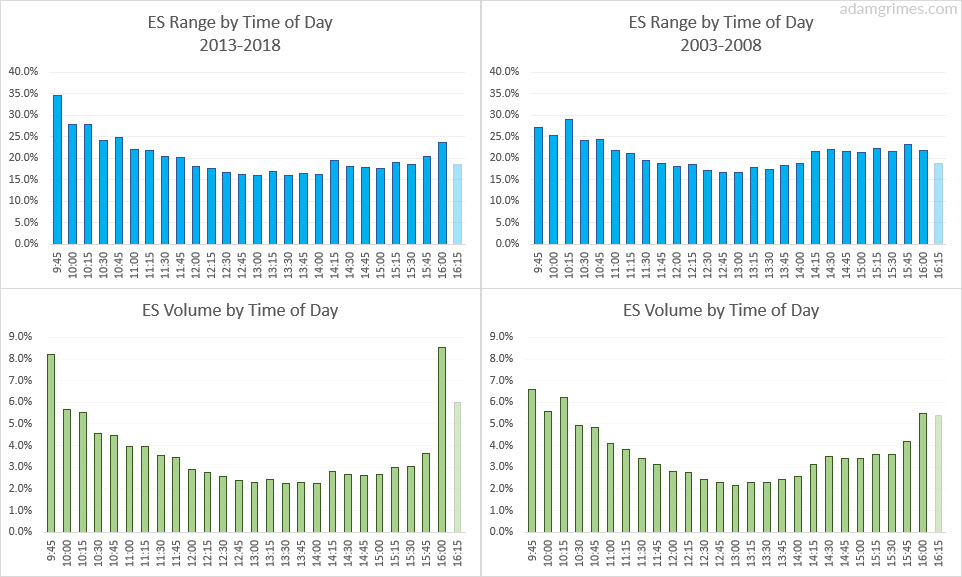
The charts below show activity by 15 minute time slices (labels are endings of the slices) for 2013-2018 (left column) compared to older data from 2003-2008. The top set of graphs show the average percent of the day's range done in that time slice. (Note that this measure will, of course, sum to more than 100%.) The bottom graphs show the percent of the day's volume done in each period. (A measure that will add up to 100%.)
A few interesting things jumped out:
- The overall shape of both graphs is relatively stable.
- Volume in the recent time period is much more concentrated on the open and close, with nearly 20% of the day's volume done in the first and last 15 minutes.
- The same general shift in range activity is also there, but it is not as extreme.
- The extreme uptick in volume on the close is perhaps the biggest difference. After-close volume has also become more significant.
- Range activity is much more concentrated near the open, rather than being spread out through the first hour of the day, as in the past.
- The tendency for the market to go "dead" around lunchtime (in Chicago!) is apparent on both graphs, as is the small bump of activity in the 14:00 EDT time zone--a time when afternoon trends begin.
What does this mean and why? I don't know, but I have some guesses: I wonder if the additional activity on the open and close are due to need to rebalance ETPs (such as levered ETF's, etc.) and perhaps to an even greater percentage of the market activity being institutional investment. It's probably the former, as the latter is usually benchmarked to VWAP executions through the day, done by algos. (Yes, many of the HTFs everyone in the media love to hate are actually working for Main Street since they are executing for pensions, etc.)
If I were daytrading, it seems the midday pool of market activity is drying up more and more. It likely makes even more sense to focus heavily on the open and close (and those periods are getting shorter--minutes instead of hours) and to try to reduce mid-day trading.
It's interesting to see such a shift in one of the fundamental aspects of the market. This likely reflects ongoing evolution of the market, but it may point to some further developments in the future.
Let me know your thoughts about this in the comments below.
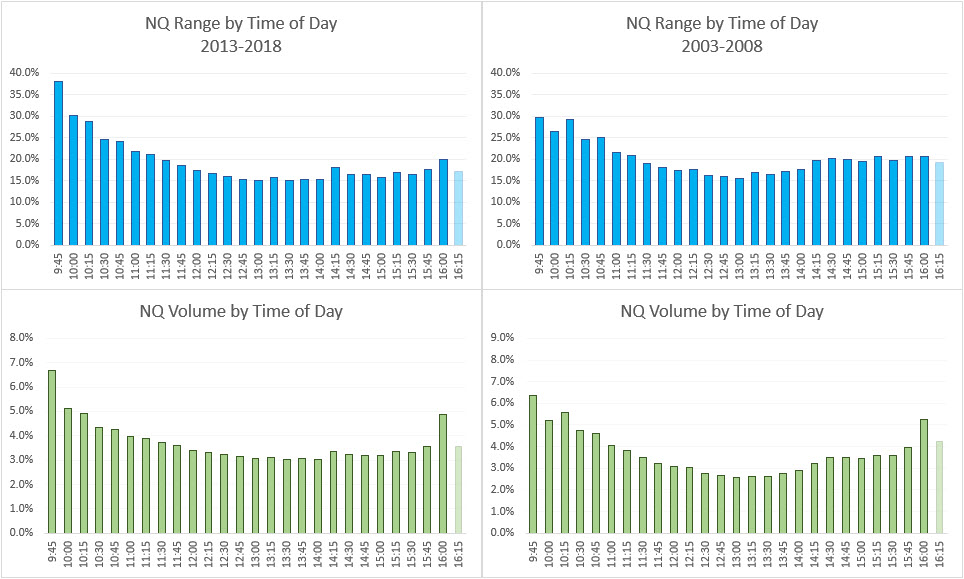
Edit: Curtis said, in the comments, that it would be interesting to see what the NQ looks like. At first I thought "it will look mostly the same", but then I thought it would be a good idea to ask the data!