[dc]I[/dc] want to share the thinking and reasons supporting a technically-motivated short position in Treasury Futures. I think it is possible to simplify the trading of patterns too much, and to imply that all a trader has to do is to simply execute some basic patterns and make money. Maybe it works like that for some people, but I’ve never personally seen anyone find enduring success with the simple pattern approach. (An objective reason might be that the market is too competitive and too “smart” to allow simple patterns with a huge edge to persist for very long.) Context is very important, but sometimes context is discussed as if the concepts are unteachable and nebulous. I’ve seen a lot of discussion of, for instance, accumulation and distribution where people say you just have to feel it on the chart. I’d also object to that. Yes, high level synthesis is important, but if you can’t delineate the major structural points, something is wrong.
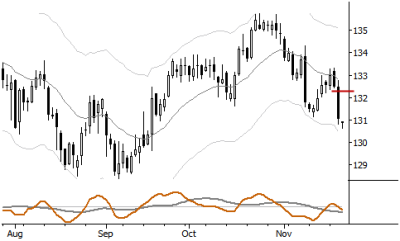
This is position that we have been watching for about two weeks in my published research. Monday night (11/18/13), I wrote that we would enter a short on a stop around 132 9/32, the red line on the chart below. Tuesday proved to be an unusually strong down day, and, as of Tuesday’s close, shorts have a nice head start and a profit equal to about 30% of the initial risk on the trade. Rather than focusing simply on a trade that, so far, is working let’s consider some other factors supporting the short, and why we’ve been leaning short on Treasuries for many months.

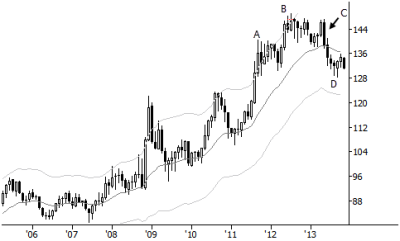
The monthly chart, below, tells an interesting story:
A. A multi-year strong bull market rolls over into a year-long flag. Remember, this is a monthly chart and patterns take a long time to play out here. This type of structure is perfectly consistent with a healthy bull market.
B. Another upthrust exhausts above the upper Keltner, and begins another long pullback. At this point, there is no reason to be anything but bullish on this timeframe.
C. The pullback begins to break to the upside, but quickly fails into a selloff. This is one of the classic pullback failure patterns that I cataloged in my book. (See, for instance, pp 73 ff.) This tells us that the bulls have stumbled here, and in a way we have not seen in the last 10 years.
D. Moderately strong downward momentum sets up a small pullback on this timeframe, and we are justified in pursuing shorts on a break out of that pattern.

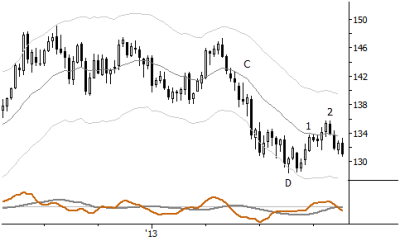
The weekly chart (below) gives a little bit more context. I have retained the letters from the monthly chart here, and highlighted two weekly points with numbers:
1. The pullback attempts a selloff, that fails and…
2. …leads to another upthrust. At this point, we’ve completed a complex pullback, a pattern which often sets up a good trend continuation trade. In this case, the intermediate term trend on this timeframe is down, so we are justified in pursuing shorts.

So, what you see here are several patterns working together. Each of them, alone, is simple to very simple, and reading them together is not excessively complicated. Many small building blocks combine to tell a simple story. Some traders may wish to simply short the breakdown on the daily timeframe, but this misses a lot of market structure and supporting context for the trade. We are not simply trading that daily pattern, we are trading a structure that shows a potential shift in dynamics that could have multi-year implications, but we are managing that trade from the perspective of a shorter-term trader on the daily or weekly timeframe–multi-year potential with precise, daily risk. If you are new to this kind of trading, one of the benefits is that you don’t have to “figure it out”. All of the concerns about the Fed doing this, tapering, QE, and other risk factors–to a large extent they do not matter for the disciplined technical trader. All you have to do is to learn to read the message of the market, and to understand the balance of buying and selling pressure as it unfolds in the market.
Nice Tutorial indeed, covered in your book. How do I get involved on your published research?
I agree – very helpful. It does take quite a bit of experience to properly process the information, though. Being a short time trader I have focused on the 15m, 2h, 4h TFs.
Thank you both. 2face I think you got in contact with Waverly’s sales desk already. Let me know if you have any questions.
And Rein, yes it does take time and experience, but I think the beginning of that knowledge is understanding what all the pieces to balance might be… keep questioning and thinking about everything. all the time.
Already in contact with Waverlys. Quite interesting on the technical update Im receiving, but missed to receive them in time due to late entry subscription, I hope to receive the next action in time so I will be able to analyse mine and trade
Every trade is just a trade… don’t worry about missing the Treasury trade… just take things one trade at a time.
what is the stops in the treasury mkt?
Hi Tony. Nothing I publish on this blog should be taken as a trade recommendation, endorsement, or advisory. I may point out patterns, in the interest of education, as examples of patterns and give some ideas about how to read those patterns, but I will not give actual trade recommendations–so please don’t read anything here in that context.
We do publish exact entry and exit points with updated stops in our daily research, and have had a very strong track record for the years we’ve been publishing. Contact [email protected] and we will be happy to set you up with a free, absolutely no-obligation trial of the research.