Here’s a good question from a reader, Said: “I know this is a very basic question, but what is momentum? I see people use it and I am not sure what they mean.”
Basic questions are often good questions. In trading, people use terms in different ways (and sometimes without really understanding them). This creates confusion for anyone trying to learn.
Here are the three most important ways you will hear momentum used:
- “Momentum” is the name given to one of the standard “indicators” of technical analysis.
- Momentum is one of the academic “portfolio factors”.
- Momentum describes certain aspects of price behavior. Strong momentum equals a strong move in a market.
The Momentum Indicator
Technical analysis grew out of a dark period when little data was available to practitioners. (Price data was limited to what could be gleaned from a newspaper, and no one even imagined applying basic statistics to price data. This is how much of the early work of TA was done.)
When early computers came on the scene in the 1970s and 1980s, “indicators” were created which were simple calculations applied to a lot of market data. Though we see today that these indicators do not add the value that was initially assumed or claimed, they did represent a significant advancement: for the first time, a consistent calculation could be applied to thousands of price bars at the click of a keyboard.
The momentum indicator is simply a percent change over a specific time period. (The calculation is today’s price / a price N periods in the past – 1. This result is multiplied by 100 to remove the decimal point. 10 on the momentum indicator = 10%.)
Momentum as a Portfolio Factor
Academic research has identified certain characteristics of groups of stocks which tend to outperform their peers. These characteristics are broadly called “factors”.
Examples of factors might be macroeconomic factors, company size, value (stock price relative to some measure of fundamental value), quality, and momentum.
In this sense, momentum is usually measured by a process like this:
- For all stocks in the investible universe, create a measure of performance over the same time period. (Though academics would blanch at the connection, this is essentially the technical analysts’ momentum indicator applied to all stocks!)
- Rank the stocks according to this performance measure.
- Take some percentage of the top-performing stocks as the momentum group.
Though it’s called momentum, we can see that the academic factor “momentum” is really a measure of relative performance (or relative strength). The assumption here (which, historically, has been true) is that the strongest, as a group, will become stronger.
Winners are found in the group of already-winners, according to this method and factor.
Momentum investing is not without its problems—always buying the strongest leaves us exposed to mean reversion and snapback, but there has been a strong edge to momentum in a diversified portfolio, over time.
Momentum and Price Behavior
This one is more complex, and I can’t really do it justice in a few hundred words.
When I say momentum, what I almost always mean is “how much the market moved over a unit of time.” This is an important way to understand the strength of the price movement. Strong price movements are driven by strong underlying psychology. Understanding this can tell us a lot about how the market is likely to move in the future.

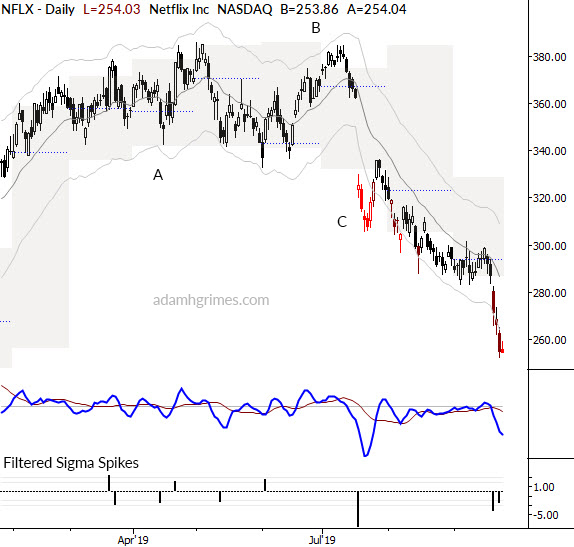
Take a look at the chart of NFLX above. There are a few lessons here.
In the area marked A), there’s really no strong momentum. While the stock touches new highs, there’s no followthrough.
Here is where an “indicator” can help: I have Keltner Channels on all of my charts for this very reason. If a market is unable to touch the Keltner Channels, that is a sign that there’s no momentum behind the moves.
Conversely, touching the Channels (see what happens around (C)) shows that there is strong momentum behind a move.
In this case, the stock made a new high at (B), without touching the upper channels, but then plummeted below the lower channel a few days later.
There are several other ways to measure momentum on this chart. The fast line (blue line) of the MACD in the middle panel of the chart is a quick-and-dirty measure of momentum. When it makes a significant move (look what happened around (C)) and a significant new high or low relative to its own recent history, this is a sign of momentum.
We can also look at the size of the daily moves themselves. I find that a volatility-adjusted measure is the best way to do this. Notice that the left half of the chart shows about an equal number of up and down sigma spikes (+/- 2 sigma). However, this changes after (C).
The large downward spike here leads to more weakness and, at the end of the chart, we can see that momentum has been mostly downward.
(Check out this post for more ideas about momentum.)
Wrapping up
There’s a lot more to be said about momentum, but understanding the ways different market participants use the term will help clear up some confusion.
All of these measures really boil down to understanding the relationship between price and time, the velocity, or “force” behind a price change.
Understanding this will give solid insights into market psychology, price behavior, and can point the way to profitable trading opportunities.