Kpos is short for “Keltner Position” and it boils down many elements of price action into a single number. I want to share some ideas for using this powerful tool, and give you some insight into how we think about it.
Channels, in general
The idea of drawing some kind of band around prices is such a good idea that there are about a bazillion different variations of this tool! The most common is Bollinger Bands, which place bands a standard deviation (of price, not returns) around a moving average. This has the advantage of responding to a certain kind of volatility in the market: the bands widen when volatility increases. However, we haven’t found Bollingers to be best in our work.
The problem with Bollingers is that standard deviation of price is kind of a strange measure. Better ideas might be standard deviation of daily changes, daily returns, or perhaps of the distance price is from the moving average. If you want ideas to play with looking for improved bands, those are some worthwhile departure points.
In our work, we’ve found Keltner Channels to be most useful. (Historical footnote: the naming of this tool is somehow confused in history. It should properly be called STARC (Stoller Average Range Channel), but no one will know what you mean if you say that. Chester Keltner was a grain trader in the 1930’s who did use a channel tool, though he didn’t claim he invented it, and his channel doesn’t really bear much resemblance to what we use today. This is a historical oddity, but something you should probably be aware of!)
Keltner Channels
Keltner channels place bands a multiple of the average true range above and below a moving average. Inputs to consider are:
- What price to use to calculate the average? (We use close for most applications.)
- Exponential or simple average? (We use exponential.)
- What time period for average? (We use 20.)
- What ATR multiple? (We use 2.25.)
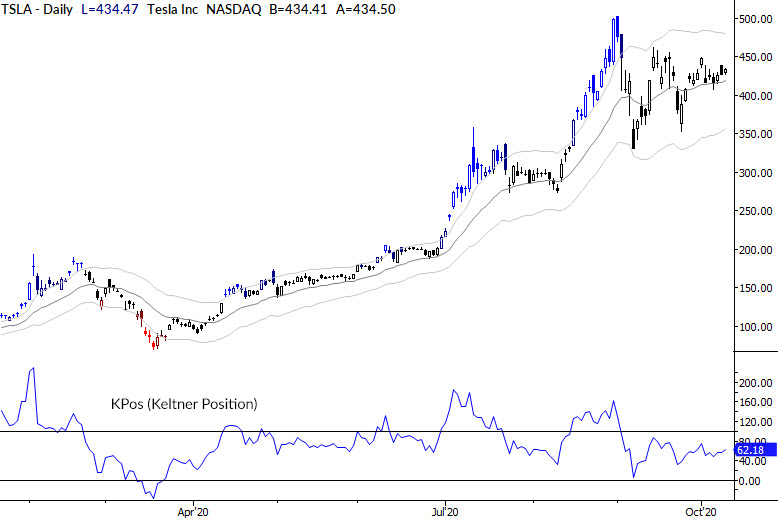
The chart above shows the channels plotted on an active stock, and you can see the width of the channels expands as the stock becomes more volatile. We find this behavior to be a bit more stable than Bollingers, and have devised a number of trading systems and have identified many clear tendencies around these channels.
What is KPos
Kpos is a measure of where price is in the channel, as a whole number percent (the percent multiplied by 100: 100% = 100). So, a market at the top channel has a Kpos of 100, on the moving average 50, and on the bottom channel 0. Kpos can be larger than 100 (above the upper channel) or less than 0 (below the lower channel). This value is available intrabar or may be calculated only on the close, depending on what you want to do with it.
Ideas for using Kpos
We do a lot with this measure, but let me just share some ideas with you.
First, it’s a quick overbought/oversold indicator. In general, we’re highly suspicious of overbought/oversold, as those are usually markets you’d rather be trading in the direction of the overextension rather than looking for mean reversion. However, simply collecting the most extreme Kpos readings of a group of markets will give you a quick look at which are most extended.
It’s also a relative strength measure, but perhaps a strange one. Because the moving average adjusts for each market’s short-term trend (sloping up more in stronger uptrends), a market has to be even strong to register a higher Kpos. One thing you can play with is ranking a group of markets by Kpos to see if it’s a meaningful measure in your universe. (But, we warned, it’s not always intuitive. You might see a market really beaten down showing a very high Kpos. Think of it as a short-term relative strength measure.)
You can also play games like keep track of markets which go > 100 or < 0 and then wait for them to come back inside the channels. These sometimes set up nice pullbacks, which can be quantified by Kpos history.
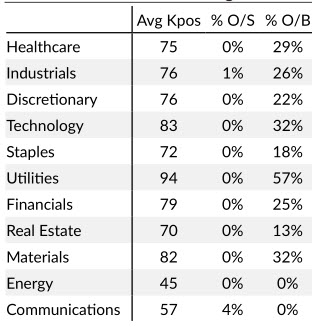
Another cool idea is to rank subgroups of stocks by Kpos. In the table above, we’ve taken the S&P 500 components and averaged the Kpos readings for each component. This gives us unparalleled insight into trend, extension, and relative strength in each sector. We use many variations of similar concepts in our weekly high-level analysis. (There’s so much more to a weekly review than just looking at charts!)
I hope these ideas are helpful, interesting, and maybe give you some ideas for your own work.