The nested pullback
This is the third article in my series on pattern recognition, and the last on pullbacks. Most patterns in markets are relatively simple, and most patterns were labeled long ago. True, there are many variations and refinements on pattern names, but there just aren't that many "new" patterns. I've said many times that I owe a tremendous debt to all of those who have come before me, as anyone working in any field does. I'm sure someone has written about this little pattern, but I haven't seen it--as far as I know, I was the first.
The nested pullback
Pullbacks are simple patterns--perhaps the most fundamental pattern in trending markets. A market makes a trend move, pauses or pulls back, and then makes another thrust in the same direction. Simple:
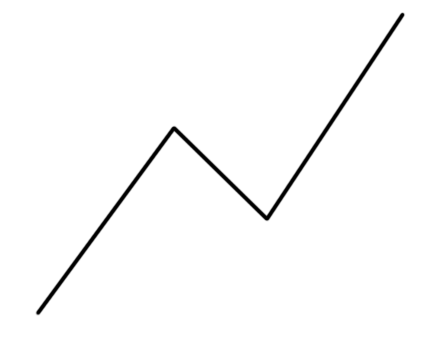
One of the strongest directional tendencies in the market happens on that leg out of the pullback; it is appropriate to think that the market is practically drawn to the target for the pullback, and there is a good probability of a clean move. The nested pullback occurs when the market makes a pause on that leg out of the pullback, looking something like this:
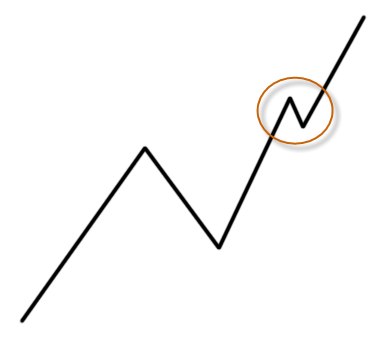
Why do we care?Now, this may not seem like a big deal. After all, it is simply another, smaller, pullback in the market, and, as I remind you all the time, markets fluctuate randomly and have a lot of noise. This pattern could be nothing more than a random jiggle. Yes, this is true, but the value in the pattern is twofold: First, we can set up good trades with these nested pullbacks. It is not uncommon to miss the pullback entry, and when we do, the presence of a nested pullback can often give us a second chance to get in. (In my research reports, I often tell clients exactly this--you should already be in the trade, but if you're not, this little nested pullback is a good secondary entry point.)
Second, these patterns matter for trade management. Newer traders, particularly, are prone to making errors when trades take a while to work out (but no one is ever immune to errors!) If we know that nested pullbacks are common and that they actually show a strong, intact move, we're less inclined to get out of the trade at the first pause, too early.
Multiple timeframes?
You might also notice that a nested pullback is often a lower timeframe pullback, or, to say the same thing another way, a simple pullback on your trading timeframe will turn out to be a nested pullback on the higher timeframe. Multiple timeframe analysis is horrifically oversimplified--this is one of the abuses of system vendors and book authors who would like you to believe you can just use an indicator on a higher timeframe and increase your probability on your trading timeframe. (Ask them for supporting statistics.) However, this little thing is a gem, and even beginning traders can use this idea effectively: some of the strongest directional moves come on the turns out of pullbacks, on any timeframe. If your higher timeframe is turning out of a pullback, then with-trend patterns on your trading timeframe will tend to work better. Like everything else, it takes some study and refinement, but this is a robust, solid concept.
As an aside, this is also a way to collapse multiple timeframe analysis into a single chart. Using multiple timeframes does not mean you always have three charts up; a skilled trader can infer the weekly chart from the daily, for instance, seeing a simple weekly pullback as a daily complex pullback, and knowing the drive out of that pattern might set up nested pullbacks on the daily.
How to trade them
There are several things you can do with this, from actually trading them as stand alone patterns to using as confirmation for trade management. If this pattern is a new idea for you, take some time to look at charts and see where this pattern has been hiding in plain sight. It does line up sometimes with the first pullback after a breakout, but, even more commonly, is simply hiding there, on that drive out of a bigger pullback.
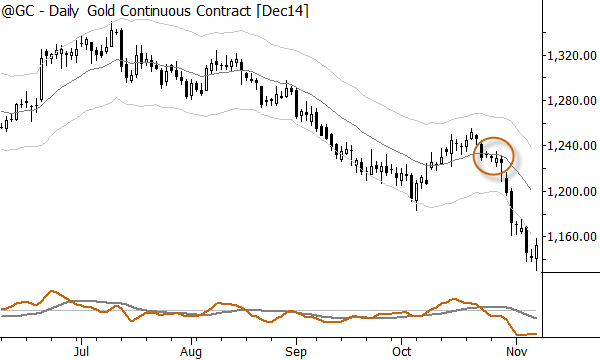
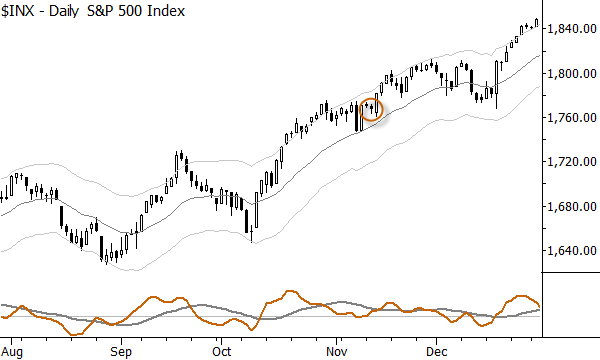
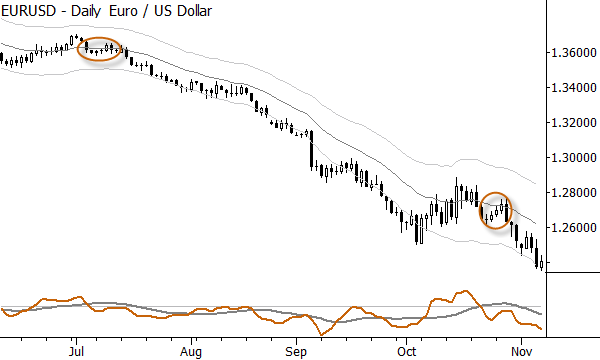
To finish, here are a few examples of nested pullbacks from recent market action:
